
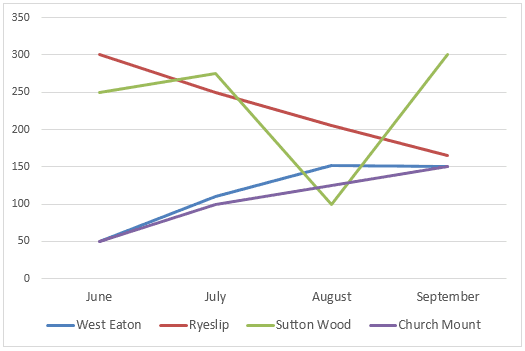
The graph compares four libraries based on their number of borrowed
books
over a recorded period of time.
Use synonyms
Overall
, Church Mount, West Eaton and Linking Words
Sutton
Use synonyms
Wood
show an increase from their initial numbers. Use synonyms
However
, Linking Words
Sutton
Use synonyms
Wood
witnessed a dramatic fall in August before rising again in September. In Ryselip, borrowed Use synonyms
books
are linearly decreasing from July to September.
In June, 300 Use synonyms
books
were borrowed from Ryselip, making it the most library that lent their Use synonyms
books
as Church Mount and West Eaton started at 50 Use synonyms
books
. Use synonyms
This
situation changed in July when Linking Words
Sutton
Use synonyms
Wood
took over the first position by having roughly 275 Use synonyms
books
taken for temporary use Use synonyms
while
Ryselip declined to 250 Linking Words
books
.
Use synonyms
Nonetheless
, there was a sharp decrease in August because Linking Words
Sutton
Use synonyms
Wood
only lent 100 of its Use synonyms
books
. During Use synonyms
this
time, Church Monet and West Eaton notably inclined to respectively about 125 and 150 Linking Words
books
. In September, Use synonyms
Sutton
Use synonyms
Wood
escalated again to 300 borrowed Use synonyms
books
, making them the highest in the graph.Use synonyms