
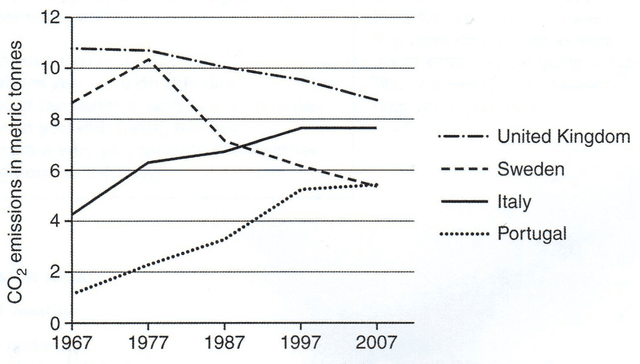
The presented line graph compares the amount of carbon dioxide produced by everyone in 4 different
country
during 4 decades from 1967 to 2007.
Change to a plural noun
countries
Overall
, Linking Words
it is clear that
Linking Words
while
in Linking Words
United
Kingdom and Correct article usage
the United
Use synonyms
Sweden
we see a great decrease in the Add a comma
Sweden,
emmision
of CO2, in Italy and Portugal the trend is totally reversed. Correct your spelling
emission
Moreover
, in 2007, Linking Words
Sweden
and Italy reached an equal level.
With regard to the figures illustrating UK and Use synonyms
Use synonyms
Sweden
consumption, in Change noun form
Sweden's
UK
, the Correct article usage
the UK
existed
carbon dioxide was about 11 metric tones in 1967, which was the highest rate Replace the word
existing
amongest
all countries , it gradually Correct your spelling
amongst
delined
to nearly 9 in 2007, Correct your spelling
declined
whereas
, in Linking Words
Sweden
, the rate was 9 in 1967, and after reaching the peak point in 1977 at just over 10, there was a sharp fall onward until 2007 which met less than 6.
Looking at the Italy and Portugal trend, it is noticeable that both countries experienced an upward Use synonyms
trand
from nearly 4 and 1 in 1967 to less than 8 and 6 in 2007 respectively. It is noticeable that in 2007 Correct your spelling
trend
Sweden
and Portugal Use synonyms
emmit
the same rate of carbon dioxide at just less than 6 metric Correct your spelling
emit
tones
.Correct your spelling
tonnes