
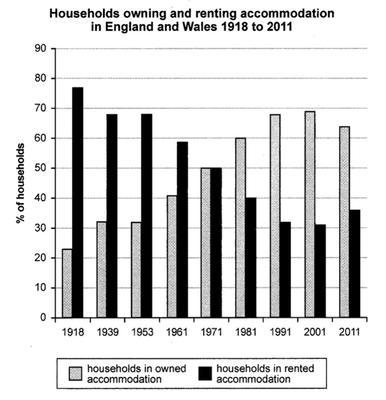
The presented bar chart delineates the changes in the proportion of two various
accommodation
types namely, Use synonyms
households
owning and Use synonyms
households
renting in two states (England and Wales) a period of nearly nine decades ( 1918 to 2011).
Use synonyms
Firstly
. We can analyse that clearly at first glance the highest rates between 1918 and 1971 are Linking Words
Households
in rented . Use synonyms
On the other hand
, Linking Words
households
in owned Use synonyms
accommodation
caught an upward tendency after 1971.
It is explicitly observed that the changes in Use synonyms
households
in rented Use synonyms
accommodation
are not stable. The highest point of Use synonyms
this
option is in 1918 with roughly 75 individuals in every hundred. Linking Words
Likewise
, it was Linking Words
this
rate that made their position the highest rate in Linking Words
this
graph. Linking Words
Besides
, in Linking Words
this
year, the lowest proportion of owned Linking Words
accommodation
type with roughly 21 people in every hundred. In 1971 two types encountered at %50. Use synonyms
Therefore
, the owned type seems Linking Words
to begin
to rise abruptly Linking Words
in contrast
to the rented type's dramatic decrease. It can be clearly seen that In 2001 preserves the lowest percentage (31 individuals in every hundred) of rented Linking Words
accommodation
and the highest percentage (69 people in every hundred) of own category Use synonyms
accommodation
.
Use synonyms
Overall
, in The rented Linking Words
accommodion
dominated areas before 1971 and after the following years (excluding 1971) owned category covered large proportions.Correct your spelling
accommodation