
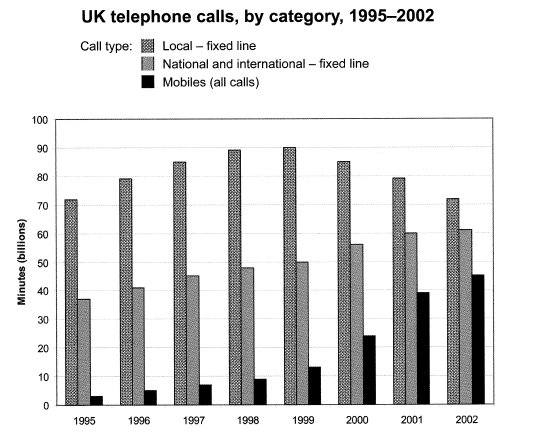
The bar graph illustrates the total number of minutes in billions of telephone calls in the UK from 1995 to 2002. The information is categorised into 3 groups: local fixed lines,national and international fixed lines, and mobiles.
Overall
,the most evident conclusion is that the local fixed line recorded the highest number of minutes throughout the Linking Words
period
. Use synonyms
While
mobiles are the lowest.
At the beginning of the Linking Words
period
, the local fixed line was around 72 minutes (billion), and it rose to 90 in 1998 and 1999, respectively. Use synonyms
Nonetheless
, Linking Words
this
figure decreased dramatically in 2002. Linking Words
On the other hand
, the national and international fixed lines experienced slight growth over the given Linking Words
period
.
Mobiles showed an upward trend. In 1995, Use synonyms
this
figure was below one-tenth. Linking Words
However
, it peaked Linking Words
at the end
of the Linking Words
period
at approximately 40.Use synonyms