
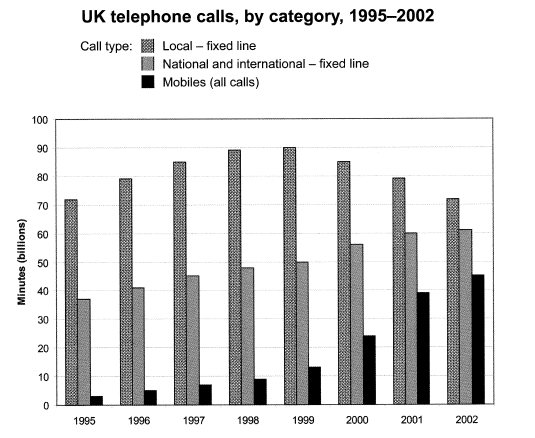
The bar chart illustrates minutes spent on telephone calls in the UK between 1995 and 2002 from three different call types.
Overall
, mobile and national and international calls continuously increased from 1995 to 2002. Linking Words
On the other hand
, Linking Words
although
local calls use the same fixed line as national and international, it was only inclined until 1999, before steadily decreasing its figures. Linking Words
Nevertheless
, it remained the most used call type in the UK.
Mobiles started in 1995 at around 3 Linking Words
billion
minutes, Use synonyms
then
they witnessed a huge jump in 2000 making it roughly 25 Linking Words
billion
and in 2001 by less than 40 Use synonyms
billion
. Meanwhile, national and international calls began in 1995 at about 38 Use synonyms
billion
and they steadily grew to 60 Use synonyms
billion
in 2002.
Use synonyms
However
, the local line statistic trend is different from the other two, in 1995 it already had the highest number just above 70 Linking Words
billion
, and reached its peak in 1999 at 90 Use synonyms
billion
, before gradually decreasing to approximately 71 Use synonyms
billion
in 2002.Use synonyms