A flow chart shows the process of making jam. Summarise the information by selecting and reporting the main features and make comparisons where relevant.

A flow chart shows the process of making jam. Summarise the information by selecting and reporting the main features and make comparisons where relevant.
IELTS Writing Task Chart for A flow chart shows the process of making jam. Summarise the information by selecting and reporting the main features and make comparisons where relevant.
✨ Do you want to improve your IELTS writing?
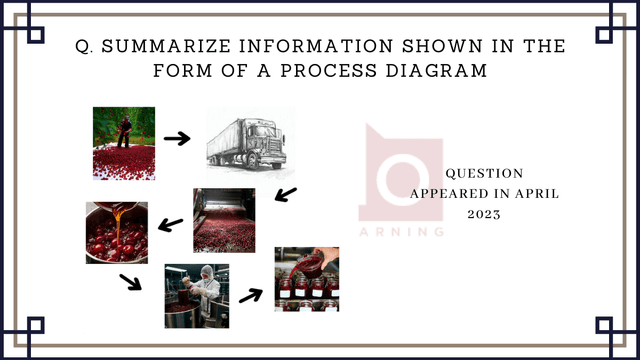
The flow chart visually illustrates the production of jam.
Overall
Linking Words
,
this
Linking Words
process involves 9 major steps to transform raw
apples
Use synonyms
into jams that are available in the grocery stores in your area.
Initially
Linking Words
, raw
apples
Use synonyms
are received and they must be sorted out to select only the good ones. Before all
apples
Use synonyms
are crushed, they need to be washed and cleaned previously.
Then
Linking Words
,
apples
Use synonyms
are crushed, and after that, they are ready to be mixed in a vessel, lime juice and water are added to the mixer as well. At the same time, the source of sucrose is screened.
Next,
Linking Words
the mixed materials are boiled in a chamber for some time. Once they are cooked, they need to rest for some time until they set.
Then
Linking Words
, jams are able to be filled into jars.
However
Linking Words
, the jars must be washed and sanitised beforehand.
Subsequently
Linking Words
, jars of jam are labelled and
finally
Linking Words
are dispatched to the distributors.

Unauthorized use and/or duplication of this material without express and written permission from this site's author and/or owner is strictly prohibited. Excerpts and links may be used, provided that full and clear credit is given to Writing9 with appropriate and specific direction to the original content.

Conclusion: The conclusion is too long.
Basic structure: Change the second paragraph.
Vocabulary: Replace the words apples with synonyms.
Vocabulary: Only 3 basic words for charts were used.
Vocabulary: Use several vocabularies to present the data in the second paragraph.
What to do next:
Look at other essays: