
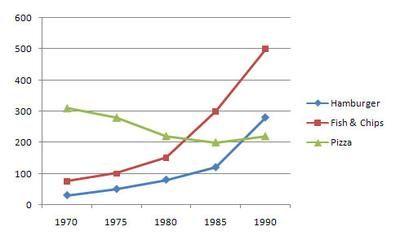
The line graph provides data about the
consumption
of Use synonyms
hamburger
, Fix the agreement mistake
hamburgers
fish
and Use synonyms
chips
and Use synonyms
pizza
in Britain from 1970 to 1990.
Use synonyms
Overall
, Linking Words
Linking Words
initially
the highest Add a comma
initially,
consumption
Use synonyms
rate
had Use synonyms
pizza
, Use synonyms
whereas
the lowest Linking Words
consumption
Use synonyms
rate
had Use synonyms
hamburger
.
As can clearly be seen, in 1970 the highest Fix the agreement mistake
hamburgers
consumption
Use synonyms
rate
Use synonyms
had
Verb problem
was
pizza
. The Use synonyms
consumption
Use synonyms
rate
was 300 Use synonyms
grams
. After 1970 the Use synonyms
consumption
Use synonyms
rate
of Use synonyms
pizza
started to decrease and in 1990 the Use synonyms
consumption
Use synonyms
rate
was approximately 200 Use synonyms
grams
. The Use synonyms
consumption
Use synonyms
rate
of Use synonyms
fish
and Use synonyms
chips
Use synonyms
initially
was less than 100 Linking Words
grams
, Use synonyms
however
, it started to increase over the years and in 1990 was its peak. In 1990 the Linking Words
consumption
Use synonyms
rate
of Use synonyms
fish
and Use synonyms
chips
was 500 Use synonyms
grams
.
In 1970, the lowest Use synonyms
consumption
Use synonyms
rate
compared to other types of fast food in Britain Use synonyms
had
Verb problem
was
hamburger
. The Fix the agreement mistake
hamburgers
consumption
Use synonyms
rate
was more or less 50 Use synonyms
grams
. In 1980 the Use synonyms
rate
rose and was almost 100 Use synonyms
grams
. From 1980 to 1985 the Use synonyms
rate
gradually increased. From 1985 to 1990 the Use synonyms
rate
abruptly rose from 100 Use synonyms
grams
to 300. In 1990 the highest Use synonyms
consumption
Use synonyms
rate
had Use synonyms
fish
and Use synonyms
chips
(500 Use synonyms
grams
), Use synonyms
while
the lowest Linking Words
consumption
Use synonyms
rate
had Use synonyms
pizza
with the Use synonyms
rate
of roughly 200 Use synonyms
grams
.Use synonyms