
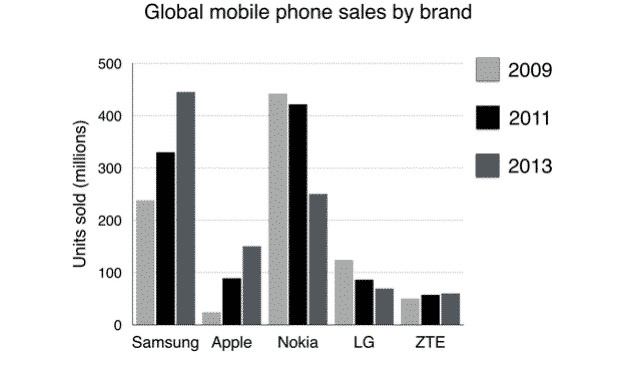
The bar chart illustrates the number of phones sold by five different mobile phone brands worldwide over the period of 4 years from 2009 to 2013.
Overall
, it is noticeable that the major sales came from Samsung and Nokia. Linking Words
In addition
, there were two opposing trends for 5 brands. Two of them strongly grew, one of them nearly remained stable and the other two were in descending tendency.
A deep analysis of the bar chart provided reveals that the highest number belonged to Samsung, which sold around 240 million phones in 2009. It continued its upward trend to reach a peak of 450 in 2013. Linking Words
Similarly
, Apple started at about 20 in 2009 and levelled up to 150 million phones in 2013 . Meanwhile, ZTE’s figures show that there was a slight and stable development when approximately 50,000,0000 to 60,000,000 items were sold over the period of 4 years.
It is clear from the chart that the sales of Nokia and LG decreased over the period of time. Nokia sold 440 million units in 2009 and the figure significantly dropped to 250 in 2013. Linking Words
Similarly
, LG’s figures went down from 120,000,000 to 80,000,000 in 2009 and 2013 respectively.Linking Words