
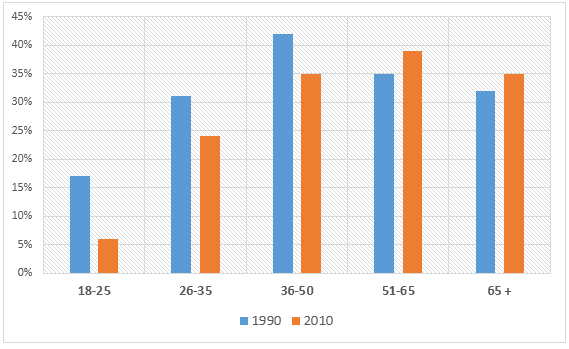
The bar chart illustrates data on the percentage of charity given by the British based on
age
starting from 18 until over 65 for 20 years.
Looking at the information from the decreasing side, the Use synonyms
age
Use synonyms
group
of 18-25 and 36-50 placed first with over 10% regression. Both of them were closely followed by the Use synonyms
age
Use synonyms
group
of 26-35 with around an 8% decrease.
Use synonyms
On the contrary
, there are two groups that have experienced quiet growth after 20 decades have passed. Linking Words
Firstly
, the Linking Words
age
Use synonyms
group
51-65 has grown by about 4%. Use synonyms
Secondly
, the over-65 Linking Words
age
Use synonyms
group
has risen by up to 3%.
Use synonyms
Overall
, the unexpected growth of money spent on charity based on Linking Words
age
is approximately 25% out of 100%.Use synonyms