
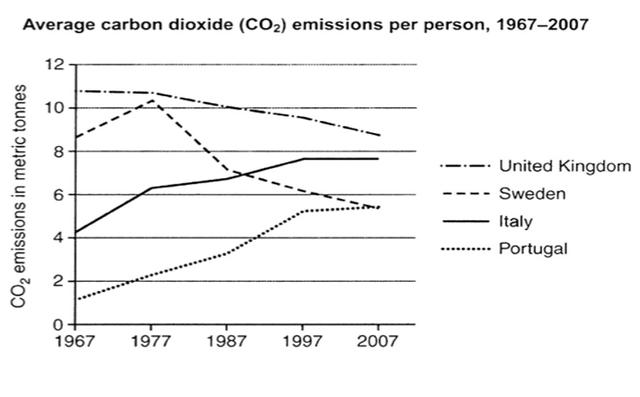
The given line graph depicts how many metric
tonnes
of CO2 Use synonyms
emissions
Use synonyms
from
per Change preposition
apply
person
in fourUse synonyms
EUropean
Correct your spelling
European
countries
from 1967 to 2007.
Use synonyms
Overall
, during these forty years, CO2 Linking Words
emissions
in Use synonyms
Sweden
experienced a remarkable decline, Use synonyms
while
in Portugal, there was an uptrend in CO2 Linking Words
emissions
.
To be specific, Use synonyms
initially
, the figure shows that each Linking Words
person
produced approximately 9 metric Use synonyms
tonnes
of CO2 in Use synonyms
Sweden
, which ranked second highest among the four Use synonyms
countries
. Simultaneously, per Use synonyms
person
in the United Kingdom produced the highest CO2 at around 11 metric Use synonyms
tonnes
. After 1977, Use synonyms
although
both Linking Words
countries
witnessed a downward decrease in CO2 Use synonyms
emissions
, the reduction of CO2 Use synonyms
emissions
from people in Use synonyms
Sweden
was much greater than that in the United Kingdom, decreasing from 10.5 Use synonyms
tonnes
to 5 Use synonyms
tonnes
by 2007.
Use synonyms
On the other hand
, CO2 Linking Words
emissions
in Italy and Portugal started at 4.2 and 1.8 metric Use synonyms
tonnes
, respectively, in 1967. Both figures increased gradually, with the former surpassing Use synonyms
Sweden
's Use synonyms
emissions
in 1987, reaching 7 metric Use synonyms
tonnes
. Use synonyms
In contrast
to the other three Linking Words
countries
, per Use synonyms
person
in Portugal produced three times more CO2, Use synonyms
finally
reaching 5.9 metric Linking Words
tonnes
by 2007, making it the country with the fastest growth in CO2 Use synonyms
emissions
.Use synonyms