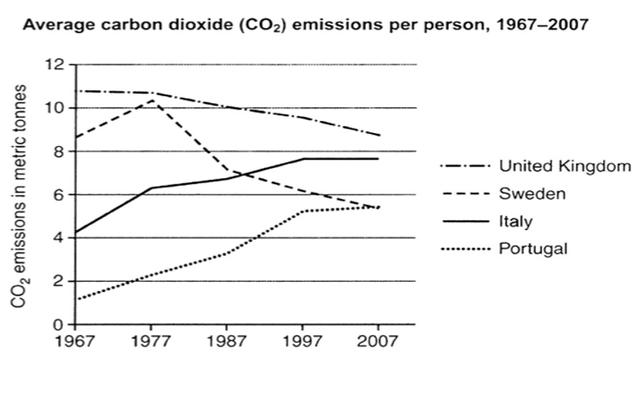
The graph below shows average carbon dioxide (CO2) emissions per person in the United Kingdom, Sweden, Italy and Portugal between 1967 and 2007.

The graph below shows average carbon dioxide (CO2) emissions per person in the United Kingdom, Sweden, Italy and Portugal between 1967 and 2007.
The line graph compares the amount of carbon dioxide
emission
for one single
person
among countries,
such
as
,
Remove the comma
apply
show examples
United
Correct article usage
the United
show examples
Kingdom, Sweden, Italy and Portugal over a period of forty years from 1967 to 2007.
Overall
, during
this
forty-year period,
United
Correct article usage
the United
show examples
Kingdom remained the biggest spenders on emissions, with all three other countries spending much less on them per
person
. In 1967 Portugal spent the least
amout
Correct your spelling
amount
of fuel per
person
,
while
Italy and Sweden spent as much as each other.
However
, by 1977,
amount
Correct article usage
the amount
show examples
of
emission
declined in Sweden and in Italy average carbon dioxide
emission
increased
until
Change preposition
to
show examples
8 metric tonnes by 1997. As can be seen from the graph, the amount of average emissions per
person
increased only in Portugal and Italy.
However
, rose the most dramatically in Portugal. The period between 1987 and 1997 saw a sharp growth and in 2007 the Portugals spent three times as much
emission
Fix the agreement mistake
emissions
show examples
as they did in 1967.
Submitted by dnm.best on

Unauthorized use and/or duplication of this material without express and written permission from this site’s author and/or owner is strictly prohibited. Excerpts and links may be used, provided that full and clear credit is given to Writing9 with appropriate and specific direction to the original content.

Linking words: Don't use the same linking words: "however".
Vocabulary: Replace the words emission, person with synonyms.
Vocabulary: The word "graph" was used 2 times.
Vocabulary: The word "amount" was used 3 times.
Vocabulary: The word "increased" was used 2 times.
Topic Vocabulary:
  • carbon dioxide emissions
  • per person
  • United Kingdom
  • Sweden
  • Italy
  • Portugal
  • graph
  • compare
  • average
  • increase
  • decrease
  • trend
  • peak
  • decline
  • years
  • period
What to do next:
Look at other essays: