
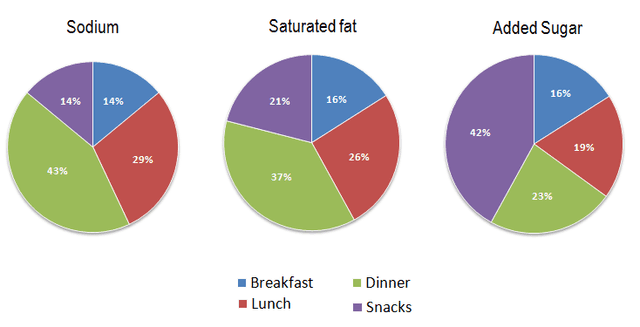
The three pie charts show information about three different kinds of nutrients and their prevalence in typical
American
meals. There are four kinds of Use synonyms
meal
mentioned, including snacks. The figures for Fix the agreement mistake
meals
sodium
and saturated fat are loosely similar, but for added Use synonyms
Use synonyms
sugar
they are quite different.
Add a comma
sugar,
Sodium
and saturated fat are both extremely common in typical Use synonyms
American
dinners. Use synonyms
According to
the pie charts, 43% of Linking Words
sodium
is consumed at dinner time Use synonyms
as well as
37% saturated fat, but just 23% of added Linking Words
sugar
is found in Use synonyms
American
dinners. An Use synonyms
American
lunch is made up of almost a third Use synonyms
sodium
, more than a quarter saturated fat, and about a fifth added Use synonyms
sugar
. Breakfasts contain the least amount of these potentially unhealthy ingredients, at 14% Use synonyms
sodium
and 16% for both saturated fat and added Use synonyms
sugar
.
The figures for snacks look quite different. These are overwhelmingly comprised of added Use synonyms
sugar
, at a staggering 42%. These foods Use synonyms
also
contain 14% Linking Words
sodium
and 21% saturated fat.Use synonyms