
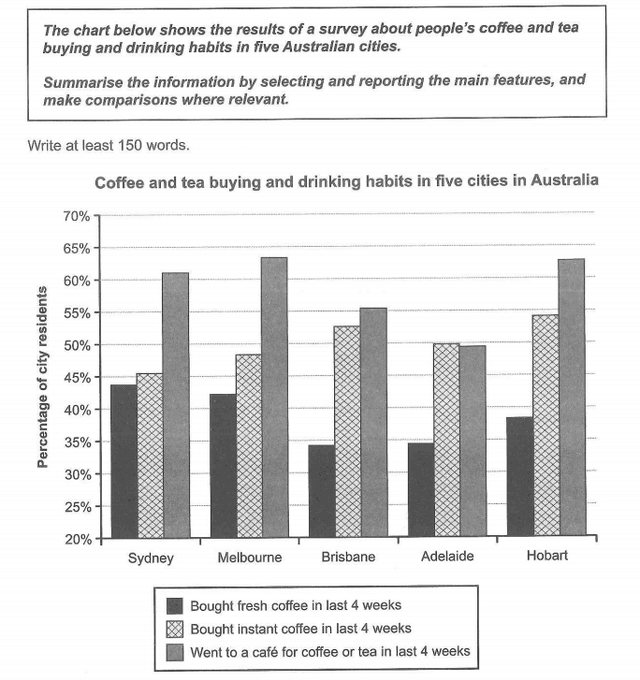
The bar chart compares the percentage of people who are divided into three categories based on the
coffee
and Use synonyms
tea
buying habits in Use synonyms
Sydney
, Use synonyms
Melbourne
, Use synonyms
Brisbane
, Adelaide, and Use synonyms
Hobart
.
Use synonyms
Overall
, it can be seen that going to a café for Linking Words
coffee
or Use synonyms
tea
was the most popular type of drinking Use synonyms
habits
among Australian peopleFix the agreement mistake
habit
,
Remove the comma
apply
while
buying fresh Linking Words
coffee
was less popular.
In terms of visiting a café for Use synonyms
coffee
or Use synonyms
tea
, citizens in Use synonyms
Hobart
and Use synonyms
Melbourne
had the highest proportion which was relatively equal at around 63%. Use synonyms
Sydney
had Use synonyms
the
second place when it Correct article usage
apply
comes
to drinking Wrong verb form
came
coffee
and Use synonyms
tea
in a café at about 60%, and after Use synonyms
that
Add a comma
that,
Brisbane
was in Use synonyms
the
third status with almost 55%. In Adelaide, a little less than half of the residents went Correct article usage
apply
café
for Change preposition
to café
tea
or Use synonyms
coffee
which was the Use synonyms
least
proportion for Correct word choice
lowest
this
trend.
Regarding Linking Words
to
buying instant Remove the preposition
apply
coffee
, it was more preferable for individuals in Use synonyms
Hobart
at about 54% and it was less preferable in Use synonyms
Sydney
Use synonyms
with
approximately 45%. Inhabitants in Change preposition
at
other
three cities Correct article usage
the other
include
Wrong verb form
including
Brisbane
, Adelian, and Use synonyms
Melbourne
drank instant Use synonyms
coffee
at 52%, 50%, and 48% respectively.
Looking at the percentage of buying fresh Use synonyms
coffee
in Use synonyms
Linking Words
last
4 weeks Correct article usage
the last
it is clear that
Linking Words
this
group wasn't the Linking Words
preferences
in all these cities. In Fix the agreement mistake
preference
Sydney
, people more enjoyed Use synonyms
this
kind of Linking Words
coffee
in comparison with others at about 43%. After that, 42% and 36% percentage of Use synonyms
Melbourne
and Use synonyms
Hobart
's citizens purchase fresh Use synonyms
coffee
. The figures for Use synonyms
Brisbane
and Adelaide were equal with 34% which is the lower rate.Use synonyms