The chart below show the average percentages in typical meals of three types of nutrients, all of which may be unhealthy if eaten too much.

The chart below show the average percentages in typical meals of three types of nutrients, all of which may be unhealthy if eaten too much.
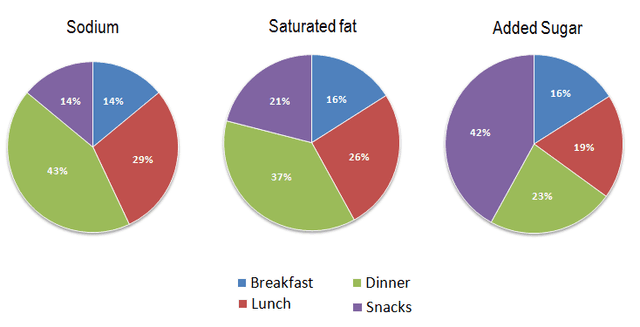
The pie charts compare the number of unhealthy ingredients namely
sodium
, saturated fat, and added sugar, in ordinary meals which are consumed by Americans.
Overall
, dinner is the most unhealthy meal among all other meals and has the highest proportion of
sodium
and saturated fat,
while
breakfast has the least harmful nutrients. As can be seen from the charts, dinner stands at first place having
sodium
and fat, accounting for 43 and 37. Followed by lunch, the share of that for
sodium
is 29,
while
saturated fat is 3 lower. In terms of breakfast and snacks, both have the same share of
sodium
at 14,
while
saturated fat is 16 and 21 respectively. the latter is responsible for the highest figure of added sugar(42,
on the other hand
, the former has the lowest amount at 16.
Submitted by soltaninejad_sahel on

Unauthorized use and/or duplication of this material without express and written permission from this site’s author and/or owner is strictly prohibited. Excerpts and links may be used, provided that full and clear credit is given to Writing9 with appropriate and specific direction to the original content.

Linking words: Don't use the same linking words: "while".
Common mistake: Your writing should be 150-250 words.
Vocabulary: Replace the words sodium with synonyms.
Vocabulary: The word "charts" was used 2 times.
Topic Vocabulary:
  • Nutrients
  • Unhealthy
  • Daily intake
  • Percentage
  • Carbohydrates
  • Fats
  • Proteins
  • Meals
  • Balanced diet
  • Consumption
  • Excess
  • Health implications
  • Obesity
  • Diabetes
  • Heart disease
  • Convenience foods
  • Fast foods
  • Socioeconomic factors
  • Lifestyle choices
  • Healthy eating habits
  • Dietary recommendations
What to do next:
Look at other essays: