
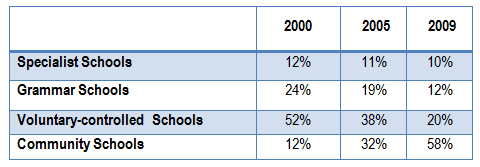
The table depicts information about the attendance of students in four different school types, from 2000 to 2009. The figures are measured in percentage.
Overall
, it is noticeable that voluntary-controlled Linking Words
classes
have the highest value in the first year, Use synonyms
while
Linking Words
this
category has the lowest value Linking Words
at the end
of the period. Linking Words
Moreover
, it is Linking Words
also
interesting to note that community schools are the only Linking Words
classes
that have an upward trend among the others.
The Use synonyms
number
of students attending specialist Use synonyms
classes
had a low percentage at just 12% as opposed to those who were in grammar Use synonyms
classes
which doubled Use synonyms
at
24% in 2000. Meanwhile, in the same year, voluntary-controlled Change preposition
to
classes
had the highest Use synonyms
number
of participants, which accounted for more than half the proportion. Use synonyms
Subsequently
, all of these figures continually declined to the low points until the end of the period. Taking voluntary-controlled schools Linking Words
for example
, there was just a fifth of all students joined these Linking Words
classes
, and Use synonyms
this
Linking Words
number
was the smallest Use synonyms
number
compared with other Use synonyms
classes
. Use synonyms
Furthermore
, for community schools, even though there was a small percentage of attendance in the beginning, Linking Words
this
learning led the value with nearly two-thirds proportion in 2009.Linking Words