
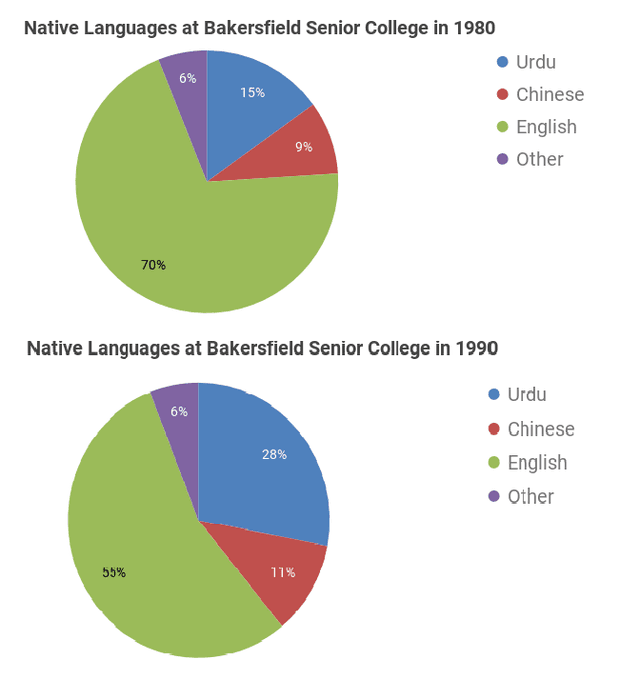
The pie charts illustrate five different types of mother tongues (Urdu, Chinese, English and
other
) spoken by Fix the agreement mistake
others
students
at Bakersfield Senior College in 1980 and 1990. Data is presented in percentage (%).
Use synonyms
Overall
, it is observed that the proportion of Linking Words
students
with English as their first language declined notably from 1980 to 1990, Use synonyms
whereas
that of Linking Words
students
speaking Urdu as the mother tongue exhibited a reverse trend. There are no significant changes for those speaking Chinese and other languages in Use synonyms
this
time period.
The percentage of Linking Words
students
speaking English as their first language reduced drastically by 15% from 70% in 1980 to 55% in 1990. Use synonyms
In contrast
, Linking Words
students
speaking Urdu showed a notable surge of 13% in ten years.
Meanwhile, Chinese-speaking Use synonyms
students
experienced a moderate increase of just 2% by the year 1990. Use synonyms
On the other hand
, the number Linking Words
for
those speaking other languages maintained a stable 6% during the study period.Change preposition
of