
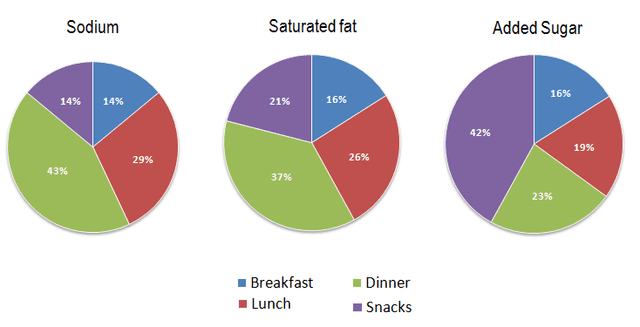
The pie charts depict the distribution of
sodium
, saturated Use synonyms
fats
, and added Use synonyms
sugar
in four average daily meals consumed by Americans. The percentages of these three nutrients in breakfast, Use synonyms
lunch
, Use synonyms
dinner
, and Use synonyms
snacks
are provided, with an emphasis on the potential health risks associated with excessive consumption.
In general, the meals consumed by residents of the USA, particularly dinners and lunches, are characterized by elevated levels of Use synonyms
sodium
and saturated Use synonyms
fats
, Use synonyms
while
Linking Words
snacks
exhibit a high proportion of added Use synonyms
sugar
.
Specifically, the Use synonyms
sodium
, Use synonyms
sugar
, and saturated Use synonyms
fats
intake during breakfast is comparatively lower, ranging around 14-16% each time. Use synonyms
However
, the intake of these nutrients significantly increases during Linking Words
lunch
and Use synonyms
dinner
. Use synonyms
Lunch
consists of 29% Use synonyms
sodium
, 26% saturated Use synonyms
fats
, and nearly 20% Use synonyms
sugar
. American citizens consume much higher percentages of these potentially harmful nutrients during Use synonyms
dinner
, with Use synonyms
sodium
at 43%, saturated Use synonyms
fats
at 37%, and Use synonyms
sugar
at 23%. Use synonyms
Additionally
, the Linking Words
snacks
enjoyed by Americans contain high levels of Use synonyms
sugar
and Use synonyms
fats
, constituting 42% and 21%, respectively. Notably, the Use synonyms
sugar
intake in Use synonyms
snacks
surpasses that of both Use synonyms
dinner
and Use synonyms
lunch
, underscoring the importance of moderation Use synonyms
due to
potential health risks associated with these dietary patterns.Linking Words