
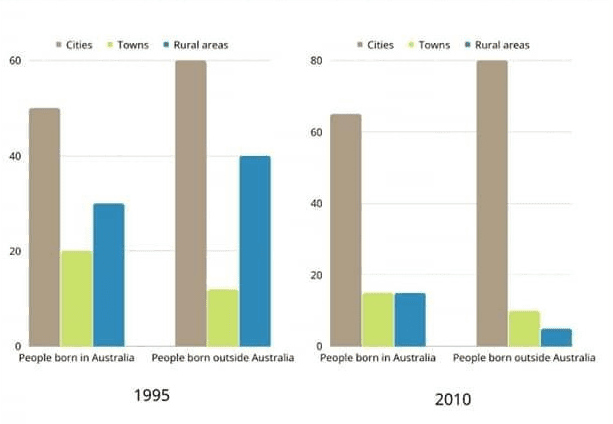
The given chart shows the proportion of citizens originating from and outside of
Australia
with their residence area of choice from 1995 to 2010.
Use synonyms
Overall
, it can be concluded that cities had the most people in 1995 and 2010, with a relatively stable rise between the periods. Linking Words
However
, Linking Words
this
can not be said the same with suburbans as they witnessed a wild decrease followed by towns that are much tamer in comparison. Linking Words
This
trend happened to both segments of individuals born inside and outside of Linking Words
Australia
.
Since 1995, urbans have been leading the number with more than half of Use synonyms
Australia
's inhabitants. Use synonyms
This
amount turned out to be higher for those not from Linking Words
Australia
, standing at precisely 60%. In the next following years, the number experienced a moderate increase Use synonyms
by
around 15% to 20% for both groups.
At the beginning of the period, rural areas placed second in density, with immigrants scoring higher at 40% and Australians at around 30%. Despite Change preposition
of
this
, the gap widens Linking Words
at the end
of the period, dramatically falling by more than 30%. Linking Words
As a result
of Linking Words
this
, it Linking Words
also
has the lowest number of outside-born residents, hitting a trough at around 5%. Linking Words
Similarly
, towns Linking Words
also
saw a slight fall in proportion as years went by, with up to a 10% difference.Linking Words