
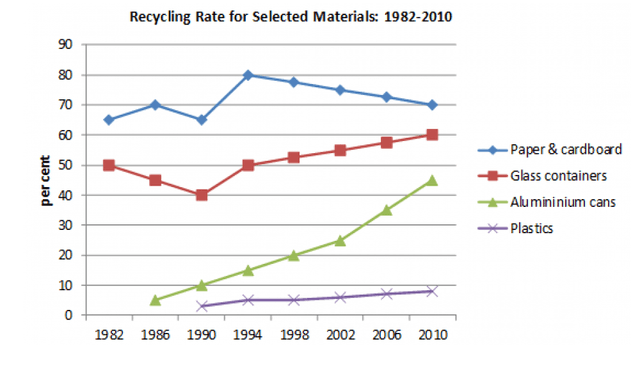
The diagram illustrates information about the
percentage
of four diverse Use synonyms
items
which reproduced between 1982 and 2010.
Based on the information presented, the number of reproduced Use synonyms
items
of Use synonyms
paper
& and Use synonyms
cardboard
, glass containers, aluminium cans as well and plastics experienced an upward trend. Use synonyms
However
, there was a slight fluctuation in the number of Linking Words
paper
& Use synonyms
cardboard
and glass containers of recyclable Use synonyms
items
before they increased.
The initial Use synonyms
percentage
of reproduced Use synonyms
paper
and Use synonyms
cardboard
Use synonyms
items
was approximately 65% in 1982. Use synonyms
Then
, Linking Words
this
number experienced a negligible rise to exactly 70% in 1986. The fraction of regenerated products dropped to its starting point(65%) for the Linking Words
paper
& Use synonyms
cardboard
in the year 1990. Use synonyms
Nevertheless
, in 1994, Linking Words
this
figure recovered and reached the highest peak at 80% before it began to decline gradually until it stopped at 70% Linking Words
at the end
of the period.
In 1982, The Linking Words
percentage
of regenerated Use synonyms
paper
& and Use synonyms
cardboard
products was 50%. But, Use synonyms
then
Linking Words
this
figure decreased until 1990, when it reached 40%. Linking Words
Next,
the Linking Words
percentage
of reproduced Use synonyms
items
of glass containers recovered to 50% during 1994, and after that, it rose steadily until reaching 60% in the year 2010. The fraction of regenerated aluminium cans was almost 5% in 1986 but Use synonyms
then
started to soar until it reached 45% Linking Words
at the end
of the period. There was a slight oscillation in the Linking Words
percentage
of regenerated plastic Use synonyms
items
, starting from roughly 5% in 1990 and ending at 8% Use synonyms
at the end
of the period.Linking Words