The bar chart below describes some changes about the percentage of people were born in Australia and who were born outside Australia living in urban, rural and town between 1995 and 2010. Summarise the information by selecting and reporting the main features and make comparisons where relevant. You should write at least 150 words.

The bar chart below describes some changes about the percentage of people were born in Australia and who were born outside Australia living in urban, rural and town between 1995 and 2010.

Summarise the information by selecting and reporting the main features and make comparisons where relevant.

You should write at least 150 words.
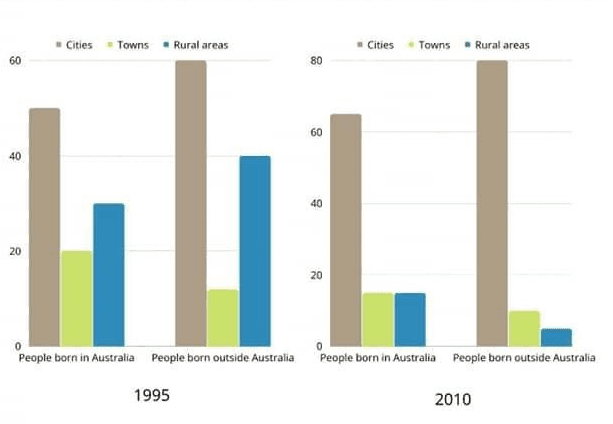
The bar chart illustrates the different quantity of
people
who
living
Change the form of the verb
live
show examples
in three places (
towns
, rural areas, and cities) between 1995 and 2010. The
people
are divided into two categories, born in and outside
Australia
. All the data was presented in percentages. In general, cities were the most places where
people
lived in 1995 and 2010,
while
towns
and rural areas only have a small portion. In 1995, both
people
who lived in and outside
Australia
preferred to live in cities with a total of 50% and 60% respectively, followed by
towns
with a total percentage of 30% and 40 each.
Moreover
,
Add an article
the town
show examples
town
Fix the agreement mistake
towns
show examples
became the least choice place for living with
the
Correct article usage
a
show examples
percentage of 20% for those who were born in
Australia
and around 10% for outside
Australia
. In 2010, there was a significant increase in population in the city by almost 20%. Meanwhile, the
towns
showed a drastic decrease, around 20% for
people
who were born in
Australia
and 30% outside
Australia
. The rest, rural areas experienced a slight drop of under 10% for both categories.
Submitted by kucinglab on

Unauthorized use and/or duplication of this material without express and written permission from this site’s author and/or owner is strictly prohibited. Excerpts and links may be used, provided that full and clear credit is given to Writing9 with appropriate and specific direction to the original content.

Vocabulary: Replace the words people, towns, australia with synonyms.
Vocabulary: The word "percentages" was used 3 times.
Vocabulary: The word "around" was used 2 times.
Vocabulary: Use several vocabularies to present the data in the second paragraph.
Topic Vocabulary:
  • Percentage
  • Demographic
  • Trends
  • Urban areas
  • Rural areas
  • Town
  • Native-born
  • Foreign-born
  • Migration patterns
  • Economic factors
  • Government policies
  • Increase
  • Decrease
  • Steady
  • Peak
  • Trough
  • Time frame
  • Significant changes
  • Distribution
  • Notable
What to do next:
Look at other essays: