
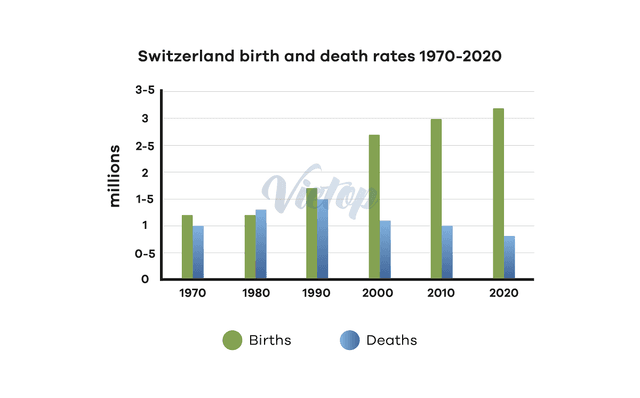
The information about the life death
expectency
and fatality Correct your spelling
expectancy
rate
of Switzerland during the Use synonyms
Use synonyms
year
1970 to 2020 has been Fix the agreement mistake
years
portry
by Correct your spelling
portrayed
United
Correct article usage
the United
Nation
statistics bar graph. The data has been Fix the agreement mistake
Nations
calibarated
in Correct your spelling
calibrated
millions
. Use synonyms
Overall
it can be seen that birth Linking Words
Use synonyms
rate
are showing Fix the agreement mistake
rates
longitudinal
increase in subsequent years.
To Add an article
a longitudinal
the longitudinal
beign
with, In Correct your spelling
begin
Use synonyms
year
1975, Change the article
the year
born
Verb problem
the birth
rate
of people Use synonyms
were
marked at around 1.2 Correct subject-verb agreement
was
Use synonyms
millions
, Change to singular
million
while
the mortality Linking Words
rate
was depicted Use synonyms
around
1 million. After that, in Change preposition
at around
Use synonyms
year
1985,Change the article
the year
Add an article
the
rate
was seen in reverse Use synonyms
prapotional
Correct your spelling
proportional
however
, the number of Linking Words
new born
Correct your spelling
newborn
were remain
constant. There was a dramatic Change the verb form
were remained
were remaining
increased
manifested in the Change the form of the verb
increase
rate
of death in Switzerland, which accounted highest 1.4 million in the Use synonyms
year
1995 Use synonyms
compare
to any other Change the form of the verb
compared
year
. In the same Use synonyms
year
population growth Use synonyms
also
Linking Words
has
started Unnecessary verb
apply
upward
trend.
There is a drastic Add an article
an upward
increased
Replace the word
increase
menifested
in the Verb problem
apply
rate
of birth in Switzerland, it comprised of 1.5 to 3 Use synonyms
Use synonyms
millions
between 2005 Change to singular
million
to
2025. Correct word choice
and
On the other hand
, a measurable Linking Words
down fall
is seen in the Correct your spelling
downfall
aging
Change the spelling
ageing
poplulation
in subsequent years, which dropped by 1.5 million to 0.5 Correct your spelling
population
Use synonyms
millions
between Change to singular
million
the
2005 to 2025.Change the article
apply