
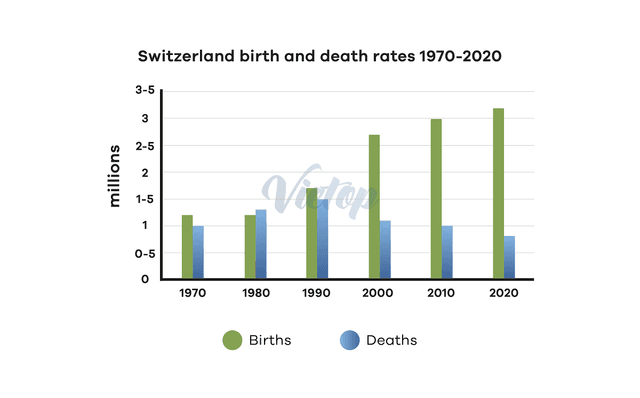
The picture displayed here is
an information
about the Remove the article
information
a piece of information
birth
and Use synonyms
death
rates in Switzerland from Use synonyms
year
1970 to 2020 from United Nations statistics.
The graph shown has 2 bar charts Use synonyms
on
each Change preposition
for
year
Use synonyms
throughout
1975 to 2025. Change preposition
from
On
the picture, the red chart shows the Change preposition
In
birth
Use synonyms
rate
, and the light blue chart shows the Use synonyms
death
Use synonyms
rate
Use synonyms
on
the country. Change preposition
in
On
1975, the starting Change preposition
In
year
, the Use synonyms
birth
Use synonyms
rate
Use synonyms
displays
1.2 Verb problem
was
million
and the Use synonyms
death
Use synonyms
rate
Use synonyms
displays
1 Verb problem
was
million
. Use synonyms
On
the following years, the improvement Change preposition
In
remain
stagnant Change the verb form
remains
to
Change preposition
at
1.7
Correct article usage
a 1.7
milion
Correct your spelling
million
of
Change preposition
in
Use synonyms
birth
Correct article usage
the birth
rate
and 1.5 Use synonyms
million
Use synonyms
of
Change preposition
in
Use synonyms
death
Correct article usage
the death
rate
by the Use synonyms
year
1995. Use synonyms
On the other hand
, 10 years later, Linking Words
on
Change preposition
in
Use synonyms
year
Change the article
the year
2005
the bar chart shows a significant rise Add a comma
2005,
on
the Change preposition
in
birth
Use synonyms
rate
to 2.7 Use synonyms
million
and the Use synonyms
death
Use synonyms
rate
went down to 1.1 Use synonyms
million
. Use synonyms
On
the Change preposition
In
year
2025, the changes were similar to Use synonyms
of
the Correct pronoun usage
those of
year
2005, where Use synonyms
Use synonyms
birth
Add an article
the birth
rate
increased more to 3.2 Use synonyms
million
, and the Use synonyms
death
Use synonyms
rate
reduced to 0.8 Use synonyms
million
.Use synonyms