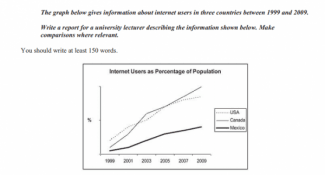
The graph below gives information about internet users in three countries between 1999 and 2009. Write a report for a university lecturer describing the information shown below. Make comparisons where relevant.

The graph below gives information about internet users in three countries between 1999 and 2009. Write a report for a university lecturer describing the information shown below. Make comparisons where relevant.
This
line chart presents the percentage
for
Change preposition
of
show examples
internet
users
in
USA
Correct article usage
the USA
show examples
,
Canada
and Mexico from 1999 to 2009.
Overall
, There was a significant increase trend in three countries in 10 years.
Canada
increased the fastest. In
Canada
, there was a dramatic
rose
Replace the word
rise
show examples
in 1999-2003.
Then
the percentage went up slightly from 2003 to 2009. Mexico has the
less
Change the quantifier
fewer
show examples
internet
users
in these years. There was a gradual rose trend between 1999 to 2009.
USA's
Correct article usage
The USA's
show examples
internet
users
got the highest
percent
Replace the word
percentage
show examples
in 1999. It
clmbed
Correct your spelling
climbed
modestly. In 2009,
USA's
Correct article usage
the USA's
show examples
internet
users
less
Add a missing verb
were less
show examples
than
Canada
's.
Submitted by asllchkied on

Unauthorized use and/or duplication of this material without express and written permission from this site’s author and/or owner is strictly prohibited. Excerpts and links may be used, provided that full and clear credit is given to Writing9 with appropriate and specific direction to the original content.

Sentences: Add more complex sentences.
Common mistake: Your writing should be 150-250 words.
Vocabulary: Replace the words internet, users, canada with synonyms.
Vocabulary: The word "percentage" was used 2 times.
Vocabulary: The word "trend" was used 2 times.
Vocabulary: The word "increase" was used 2 times.
What to do next:
Look at other essays: