
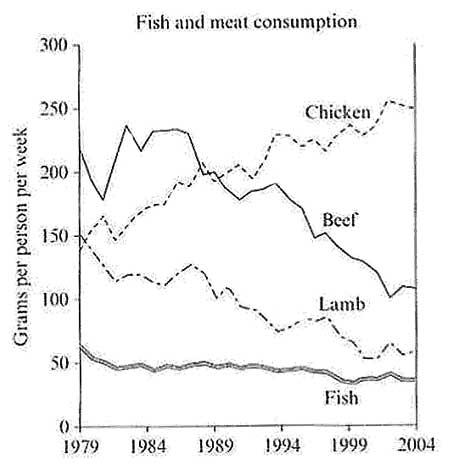
The given line chart illustrates how much
fish
and other types of meat was consumed in a European country over the Use synonyms
period
of 25 years from 1979 to 2004. Units are measured in grams eaten per person per week.
Use synonyms
Overall
, it can be clearly seen that all of the Linking Words
fish
and meat Use synonyms
consumption
fell throughout the given Use synonyms
period
, with the exception of chicken. Use synonyms
Beef
was the highest Add an article
The beef
consumption
at the start, Use synonyms
Linking Words
however
it was Add a comma
however,
being
surpassed by chicken by the Unnecessary verb
apply
end
of the Use synonyms
period
.
In terms of the highest Use synonyms
consumption
Use synonyms
at the
Linking Words
end
, chicken started at just below 150 in 1979. Use synonyms
Then
, it Linking Words
is
experienced a moderate increase, before slightly Unnecessary verb
apply
dropped
to precisely 150 in the next 5 years. Wrong verb form
dropping
Furthermore
, It gradually incline and reached a peak of 250 by 2004.
Regarding the other three consumptions, beef stood at about 220, became the highest Linking Words
consumption
, followed by lamb and Use synonyms
fish
which accounted for exactly 150 and over 50, respectively. Beef witnessed a fall to around 170. Use synonyms
Moreover
, it Linking Words
is
dramatically surged to around 230, before Unnecessary verb
apply
declined
and Wrong verb form
declining
hit
a trough Wrong verb form
hitting
to
just above 100 by the Change preposition
of
end
of the Use synonyms
period
. Use synonyms
In contrast
, lamb had a decrease since the beginning until it reached 70 in 2004. Linking Words
Similarly
, Linking Words
fish
saw a Use synonyms
slightly
fall to just below 50 and remained steady until the Change the adverb
slight
end
of intervals.Use synonyms