
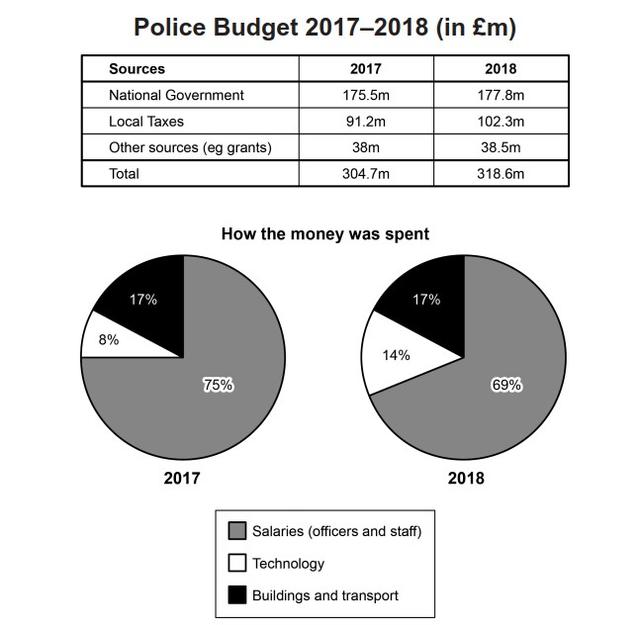
The figures show financial allocation and sources for police in the British area between 2017 and 2018. The table above illustrates three distinct streams of revenues in both years expressed in millions of pounds sterlings
while
the pie chart below presents the percentage of distribution into three uses (salaries, technology, and buildings and transport).
Linking Words
Overall
, a notable increase in total budget from the year 2017 to 2018 is observed Linking Words
whereas
there was not any significant variety of spending. Linking Words
Besides
, the money received from all the categories of income origin experienced an upward trend. On the other side, only two categories of expenditure had a little shift, Linking Words
while
the other one remained stable.
Linking Words
Firstly
, the biggest rise in the budget component came from local taxes categories which rose from 91.2 to 102.3. The other two were far behind with less than 2.5 growth, Linking Words
although
the biggest part of the money was received from the national government in both years with 175.5 and 177.8 respectively. Linking Words
Furthermore
, grants only made up less than 40 with the least quantity of change (only 0.5 from 2017 to 2018).
In terms of how the money was spent, the expense in wage payment for the officers and the staff accounted for three-quarters in 2017, even though the fragment fell to just below 70% in 2018. The spending on technology climbed by 6% from 8% in the first year to 14% in the next year. Linking Words
However
, building and transport allocation stayed the same within both years.Linking Words