
The
three
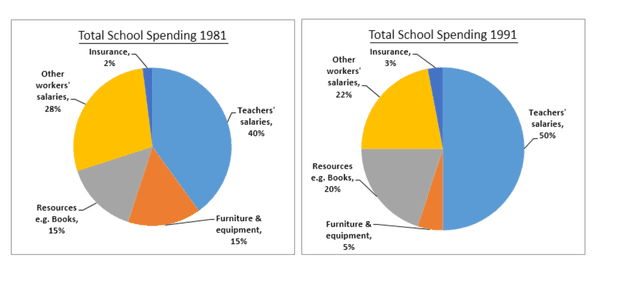
pie charts provide information about Use synonyms
a
Correct article usage
the
proportion
of annual Use synonyms
expenditure
in a UK school in Use synonyms
three
different Use synonyms
years
, (1981, 1991, and 2001)
Use synonyms
Overall
, Linking Words
it is clear that
the highest amount of money was spent on teachers’ salaries in all Linking Words
years
, Use synonyms
while
insurance received the smallest Linking Words
proportion
.
Use synonyms
It is clear that
the vast majority of the total Linking Words
expenditure
was allocated to teachers' salaries in all Use synonyms
three
Use synonyms
years
, accounting for 40%, 50%, and 45% of total spending respectively. The school spent Use synonyms
a
second largest Correct article usage
the
proportion
of its Use synonyms
expenditure
on other workers’ salaries in both 1981 and 1991, at 28% and 22% respectively. Use synonyms
However
, Linking Words
this
Linking Words
proportion
decreased to only 15% in 2001. Use synonyms
While
spending on furniture and equipment decreased from 15% to 5% between 1981 and 1991, it increased by almost a quarter in 2001.
In 1981, 15% of the school's Linking Words
expenditure
was on resources, which increased slightly in 1991 and dropped to 9% in 2001. Use synonyms
However
, insurance received the smallest share of the Linking Words
expenditure
in all Use synonyms
three
Use synonyms
years
, at 2%, 3%, and 8%, respectively.Use synonyms