The line graph below shows changes in the amount and type of junk food consumed by Australian teenagers from 1975 to 2000

The line graph below shows changes in the amount and type of junk food consumed by Australian teenagers from 1975 to 2000
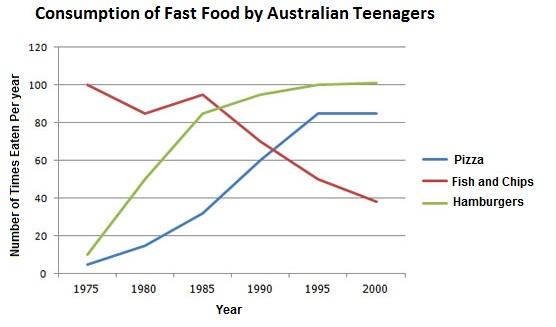
The given illustration depicts information on the consumption of unhealthy types of food among teenagers who live in Australia over a 25-year period. A glance at the graph makes it clear that
,
Remove the comma
apply
show examples
there was a dramatic growth in hamburgers and pizza
while
fish and chips experienced a fluctuation process which is followed by
slight
Correct article usage
a slight
show examples
fall. Turning to the details, it is clearly seen that fish and chips were the highest employed type of food from 1975 to 1985,in
these period
Change the determiner
this period
these periods
show examples
of time
it
Correct pronoun usage
they
show examples
fluctuated
noticebly
Correct your spelling
noticeably
, which shows 100
then
decreased
for
Change preposition
to
show examples
almost 80
then
went down gradually. By 2000 year they made up 40 times eaten per year. Regarding pizza and hamburgers , they saw a sharp increase from 10 times eaten per year, both reached 80 and 100 respectively. It is interesting to note that, from 1995 both of them (Pizza and hamburgers) leveled off.
Submitted by omarovaa.access on

Unauthorized use and/or duplication of this material without express and written permission from this site’s author and/or owner is strictly prohibited. Excerpts and links may be used, provided that full and clear credit is given to Writing9 with appropriate and specific direction to the original content.

Introduction: The introduction is missing.
Introduction: The chart intro is missing.
Common mistake: Your writing should be 150-250 words.
Introduction: The chart intro is missing.
Topic Vocabulary:
  • Fluctuate
  • Spike
  • Dip
  • Steady growth
  • Decline
  • Plateau
  • Consumption patterns
  • Fast food
  • Processed snacks
  • Health consciousness
  • Marketing influence
  • Demographic factors
  • Sedentary lifestyle
  • Nutritional education
  • Epidemiological impact
What to do next:
Look at other essays: