The pie chart below shows the main reasons why students chose to study at a particular UK university in 1987 and 2007. Summarise the information by selecting and reporting the main features, and make a comparison where relevant.

The pie chart below shows the main reasons why students chose to study at a particular UK university in 1987 and

2007. Summarise the information by selecting and reporting the main features, and make a comparison where relevant.
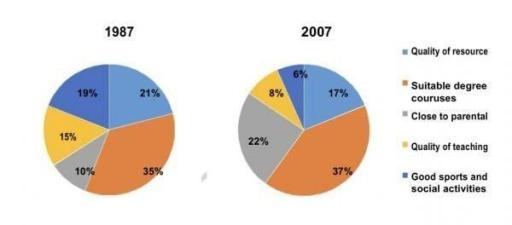
The pie graph illustrates the causes why pupils choose a specific United Kingdom in two years (1987 and 2007) measured by percentage.
Overall
,it can be clearly seen that the quality of resources is the main reason in both years.
While
the less common reason was good sport and social activities in 2007.
Also
,the second
less
Correct quantifier usage
apply
show examples
reason was close to
Correct pronoun usage
my parents
show examples
parents
Change noun form
parents'
parent's
show examples
home in 1987. During 1987 and 2007, there was a slow increase in a suitable degree course from 35% to 37% and there was a slight growth in the quality of teaching by almost 3%.
However
, the percentage of quality resources
decrease
Wrong verb form
decreased
show examples
slightly by 21% in 1987 and 17% in 2007, respectively. The number of good sports and social activities went down rapidly (about 19% to
near
Change the word
nearly
show examples
6%) in 1987 and 2007, but the figure of close to parental homes rose dramatically near 10% to approximately 22% in 1987 and 2007.
Submitted by Memmm on

Unauthorized use and/or duplication of this material without express and written permission from this site’s author and/or owner is strictly prohibited. Excerpts and links may be used, provided that full and clear credit is given to Writing9 with appropriate and specific direction to the original content.

Sentences: Add more complex sentences.
Basic structure: Change the second paragraph.
Vocabulary: The word "percentage" was used 2 times.
Vocabulary: The word "slight" was used 2 times.
Vocabulary: Use several vocabularies to present the data in the second paragraph.
What to do next:
Look at other essays: