
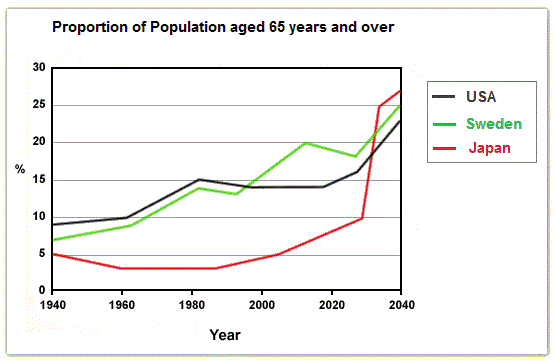
The information which has been provided by
this
graph illustrates the percentage of the elderly population aged 65 and over duration a century from 1940 to 2040 in Linking Words
Japan
, Sweden, and Use synonyms
USA
.
On the whole, what is deduced is that Correct article usage
the USA
this
proportion is on the sore trend in terms of Linking Words
aging
in these three various countries and Change the spelling
ageing
Japan
's people have had far more accelerate in getting old and foretold have had more individuals with 65 and over.
With a glance at the figures for Use synonyms
Japan
, it can be vividly seen that in 1940 Use synonyms
Japan
had the least senile persons with only 5 % and Use synonyms
this
data fluctuated between 1940 and 2000. Linking Words
Nonetheless
, afterward Linking Words
this
, proportion was dubbed from 5 %to 10 % from 2000 to 2020 and Linking Words
following
Linking Words
this
, will have rocketed significantly to approximately 27% until 2040.in 1940 Sweden was placed in the middle of Linking Words
Japan
and the USA with 7% and Use synonyms
in contrast
with Linking Words
Japan
elderly fraction Use synonyms
have
witnessed a substantial augmentation between 1940 and 1980 and after that, it Unnecessary verb
apply
leveled
up to Change the spelling
levelled
this
degree until 1990.at Linking Words
this
point in corresponding with Linking Words
Japan
, these statistics will have seen an incredible growth to 25% until 2040.
With respect to USA information, Use synonyms
this
country had more senior individuals than others in 1940 with just under 10 %. Linking Words
This
percentage increased to 15% in 1980 and Linking Words
this
trend followed with flattened between 1980 and 2020. In 2020 the surge trend of these figures commenced and will have touched roughly 23% until 2040.Linking Words