The graphs above give information about computer ownership as a percentage of the population between 2002 and 2010, and by level of education for the years 2002 and 2010. Summaries the information by selecting and reporting the main features, and make comparisons where relevant. Write at least 150 words.

The graphs above give information about computer ownership as a percentage of the population between 2002 and 2010, and by level of education for the years 2002 and 2010.

Summaries the information by selecting and reporting the main features, and make comparisons where relevant. Write at least 150 words.
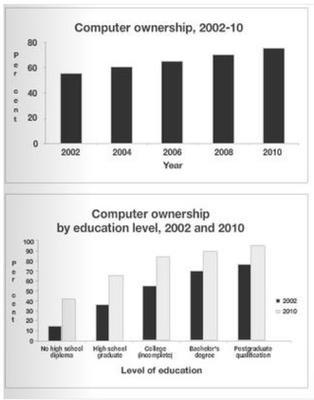
The bar graph illustrates computer ownership across different
education
levels for the years 2002 to 2010. It can be seen clearly that the occupancy of computers increased from 2002 to 2010 proportional to their
education
level. The higher their
education
, the higher the occupancy. It shows that computer ownership for postgraduate holders was the highest among
other
Change the wording
another education level
other education levels
show examples
education
level in 2002 and 2010. The second position is bachelor's degree at 70% and 90% and the third position is college students at 50% and 80% for the years 2002 and 2010 respectively. The fourth position is high school graduates at 40% and 60%.
Moreover
, the lowest computer occupancy was in the level of high school diploma, which at 10% and 40 % for the years 2002 and 2010.
Overall
, the ownership of
this
item ranges from 10% to 70% for the year 2002 and ranges from 40% to almost 100% for the year 2010.
Submitted by gestienanovitasari on

Unauthorized use and/or duplication of this material without express and written permission from this site’s author and/or owner is strictly prohibited. Excerpts and links may be used, provided that full and clear credit is given to Writing9 with appropriate and specific direction to the original content.

Basic structure: Change the third paragraph.
Vocabulary: Replace the words education with synonyms.
Vocabulary: Only 5 basic words for charts were used.
Vocabulary: Use several vocabularies to present the data in the third paragraph.
Topic Vocabulary:
  • computer ownership
  • percentage of the population
  • level of education
  • comparison
  • trend
  • increase/decrease
  • no-qualification
  • secondary
  • post-secondary
  • graduate education
  • digital divide
  • socio-economic factors
  • technological advancement
  • accessibility
  • demographics
  • statistical data
  • data interpretation
  • significant growth
  • fluctuations
  • proliferation
What to do next:
Look at other essays: