
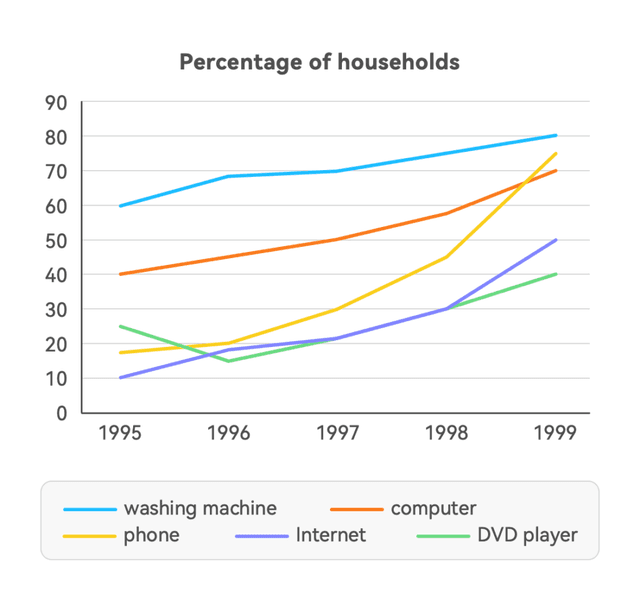
The line chart illustrates the
proportion
of houses with five types of technological devices in the United States between 1995 and 1999.
Use synonyms
Overall
, the Linking Words
proportion
of Use synonyms
households
with a washing machine, a computer, a phone, and Use synonyms
internet
connection increased throughout the entire period, Correct article usage
an internet
however
, the Linking Words
percentages
of houses having a DVD player first decreased until 1996, and Fix the agreement mistake
percentage
then
it climbed over the next Linking Words
three
Use synonyms
years
.
In 1995, 60% of the Use synonyms
households
in the U.S. had a washing machine, and Use synonyms
this
percentage inclined to just under 70% in 1996, before increasing slowly to around 70%. Linking Words
This
Linking Words
proportion
moderately climbed to just over 80% over the next two Use synonyms
years
. The Use synonyms
proportion
of Use synonyms
households
with a computer was approximately 40% in the beginning of the period, which inclined gradually to almost 60% after Use synonyms
three
Use synonyms
years
, and Use synonyms
then
it rose more Linking Words
fastly
to around 70% in 1999.
The Rephrase
quickly
percentages
of Fix the agreement mistake
percentage
households
with a phone Use synonyms
demonstated
Correct your spelling
demonstrated
an
exponential growth, starting at just under a fifth in 1995 and ending at about Correct article usage
apply
three
quarters in 1999. Use synonyms
While
roughly 10% of Linking Words
the
Correct article usage
apply
households
had Use synonyms
internet
connection Correct article usage
an internet
in
the Change preposition
at
beggining
of the period, it reached around half of the Correct your spelling
beginning
households
in the U.S. in 1999. The Use synonyms
proportion
of Use synonyms
households
with a DVD player was around a quarter in 1995, and Use synonyms
then
it dropped to about 15% after a year, before escalating modestly to around 40% over the next Linking Words
three
Use synonyms
years
.Use synonyms