The charts show world pineapple exports by the top three pineapple-producing countries in 2009 and 2019, and a breakdown of the cost to the consumer of each pineapple in 2019. Summarise the information by selecting and reporting the main features, and make comparisons where relevant. You should spend about 20 minutes on this task.

The charts show world pineapple exports by the top three pineapple-producing countries in 2009 and 2019, and a breakdown of the cost to the consumer of each pineapple in 2019.

Summarise the information by selecting and reporting the main features, and make comparisons where relevant.

You should spend about 20 minutes on this task.
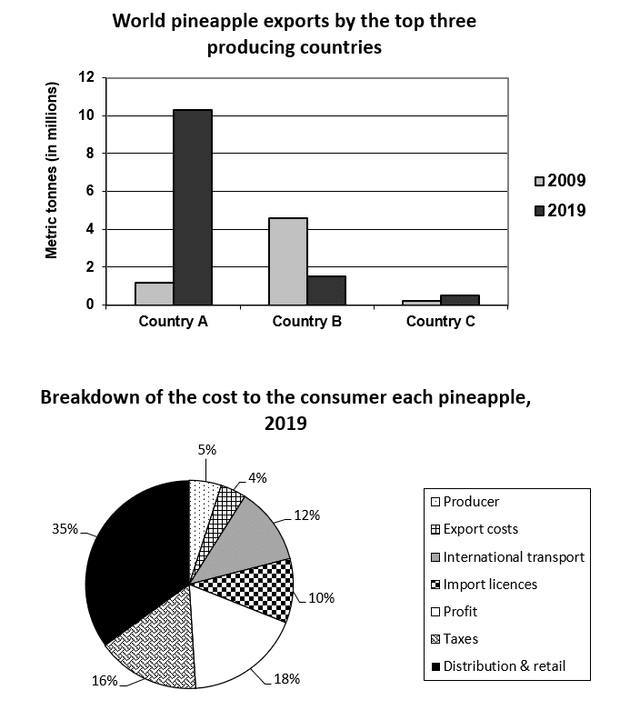
The two charts display information about pineapple. The bar
chart
illustrates the export of pineapple in three countries with instruments in millions from 2009 until 2019. Another pie
chart
displays the cost of pineapple for each consumer in per cent in the year 2019.
To begin
with, in the first
chart
, country A became the first with the highest growth from below 2 million to over 10 million in 2019. It is followed by country C with a little rise in the same year.
On the contrary
, country B has been experiencing a sharp drop since ten years ago with just below 2 million in 2019. On the second
chart
, the highest proportion of cost was distribution and retail with 35%, soon followed by profit and taxes with 18% and 16% each.
Next,
in the middle, there were international transport and import licences which accumulated about 22%.
Finally
, the producer and export costs were the lowest with an average of 4,5% each.
Overall
, the quantity of money made through exports mostly increased.
While
the cost to each consumer varies.
Submitted by alyarachmadivaa on

Unauthorized use and/or duplication of this material without express and written permission from this site’s author and/or owner is strictly prohibited. Excerpts and links may be used, provided that full and clear credit is given to Writing9 with appropriate and specific direction to the original content.

Vocabulary: Replace the words chart with synonyms.
Vocabulary: Rephrase the word "information" in your introduction.
Vocabulary: The word "charts" was used 5 times.
Vocabulary: The word "display" was used 2 times.
Vocabulary: The word "about" was used 2 times.
Topic Vocabulary:
  • charts
  • world pineapple exports
  • top three producing countries
  • 2009
  • 2019
  • breakdown
  • cost to the consumer
  • main features
  • comparison
  • relevant
What to do next:
Look at other essays: