
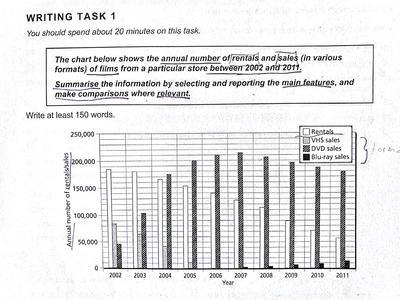
The bar chart illustrates the
quantity
of rentals and sales of films in specific shops annually from 2002 until 2011. There are 4 categories, including rentals, VHS, DVD, and Blu-ray. The unit measurement is in number.
Change the quantifier
number
Overall
, the majority of individuals prefer to buy DVDs rather than the other three to watch movies. Linking Words
Furthermore
, the rental method still being one of the most popular choices for individuals to watch movies.
Linking Words
To begin
with, the sales of DVDs have increased a lot since 2002 until they reached their peak in 2007, with over 200,000 quantities sold. Linking Words
Nonetheless
, after that, it decreased gradually with around 180,000 copies sold in 2011. Moving on, the sales of blue-ray had emerged in 2007 with around 5,000 quantities. Linking Words
Moreover
, it had a steady rise until 4 years later with over 10,000 sold.
Linking Words
On the contrary
, the people's preference for rental films had significantly fallen. It started strong in 2002 with the highest quantities just below 200,000. As the years went by, the preference of people has transitioned to buying DVDs more. Linking Words
Secondly
, population behaviour toward buying VHS had dramatically hit rock bottom. The Linking Words
last
time people still bought it was in 2005.Linking Words