
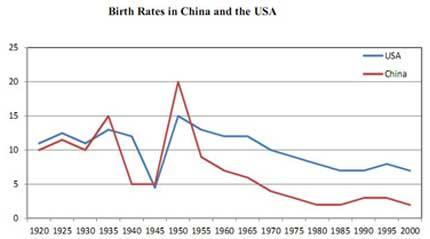
The line graph delineates the number of births in
two
Use synonyms
countries
in Use synonyms
two
Use synonyms
countries
, namely the Use synonyms
USA
and Use synonyms
China
over the 80-year Use synonyms
period
.
Use synonyms
Overall
, it is apparent that the data for these Linking Words
two
Use synonyms
countries
witnessed a downward trend throughout the Use synonyms
period
In 1920, the figures for both Use synonyms
two
nations were relatively similar, at 10 and 11, respectively. Over the Use synonyms
period
of 15 years, the birth rates in Use synonyms
China
had risen by 5, and the statistics for the Use synonyms
USA
had climbed by 3 in 1935. In the next 10 years, the birth rates had dropped dramatically to roughly 5 in both nations
From 1945 to 1950, there was an opposite trend in the Use synonyms
two
Use synonyms
countries
, with the data for Use synonyms
China
reaching its peak, at 20, followed by the Use synonyms
USA
, at 15. Throughout the Use synonyms
last
Linking Words
period
, the figures for these Use synonyms
two
nations down steadily to 6 birth rates in the Use synonyms
USA
and under 5 in Use synonyms
China
Use synonyms