
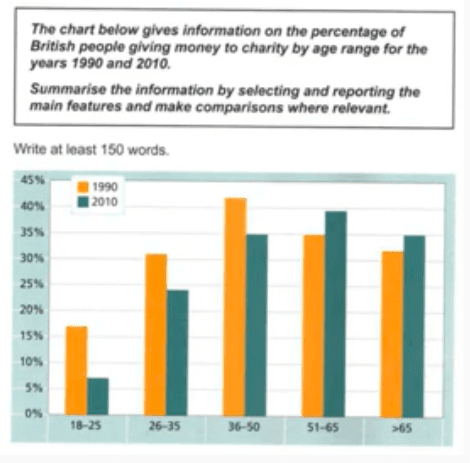
The bar chart illustrates how many people in the UK spent their wealth on compassion in 1990 and 2010, categorised by their age; 18-25, 26-35, 36-50, 51-65, and over 65
years
. Looking from an Use synonyms
overall
perspective, it is readily apparent that younger citizens donated more money in 1990, Linking Words
while
in 2010, older ones contributed more.
It can be seen that in 1990, the donation was dominated by humans aged 36 to 50 (more than 40%), followed by a group aged 51-65 (approximately 35%), slightly above 26-35 aged and elderly (nearly 32%). Linking Words
Whereas
, only about 17% of individuals between 18 and 25 Linking Words
years
old spent their money on goodwill.
In terms of the year 2010, almost 40% of 51-65-year-olds age gave their funds to the society, ahead of 36-50 and 65+ Use synonyms
years
populace (around 35%). The younger ones contributed less, by no more than 25% for the group aged 26-35 and only just over 5% for 18-25 Use synonyms
years
old.Use synonyms