
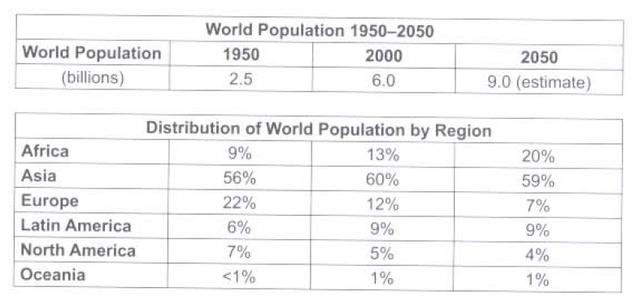
The given table provides insights into the dissemination of the global populace within six regions for 1950, and 2000 and with projections in 2050.
The table highlights that Asia is a predominantly populated region in the world. The
overall
trend emphasizes an increase in global society in the projected year. Linking Words
Nevertheless
, through time Africa is expected to rise substantially Linking Words
while
the European populace may experience a downward trend.
Linking Words
According to
the data, it is evident that the African community has shown a progression starting from 9% in 1950 to 13% in 2000 with an expected reach of up to 20% of the total population in 2050. Following that, Asia had a coverage of 56% in 1950 with slight growth to 60% in 2000 and approximately will remain unchanged with an insignificant loss of 1% in 2050. Linking Words
Lastly
, the Europeans have experienced an enormous drop in population from 22% in 1950 to 12% in 2000 and it is predicted that it will continue to fall down to 7% in the estimated year.
Linking Words
Conversely
, two American continents and Oceania remained stable within a 50-year period from 1950 with minimal fluctuations. Specifically, the Latin American people have grown from 1950 (6%) to 9% in the next 50 years and it is anticipated that it will maintain a similar level. Linking Words
On the contrary
, there was a gradual decline of North Americans from 7% in 1950 to 5 % in 2000 with a prediction of a 1% drop in 2050. Ultimately, Oceania accounted for less than 1% in the beginning and it will stay around 1% during the next hundred years.
The World public showcased a remarkable growth from 1950 with around 2.5 billion people to approximately 6 billion people in 2000 and it is forecasted to reach 9 billion by the end of 2050.Linking Words