
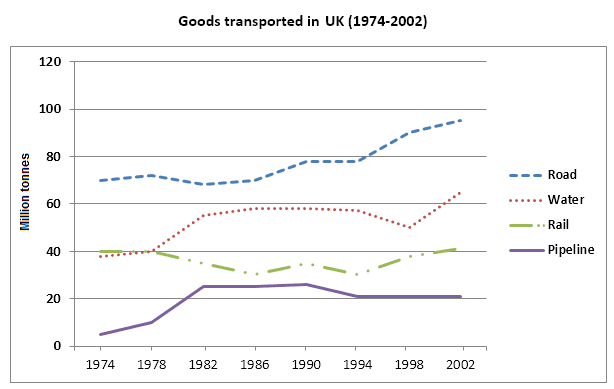
The line chart illustrates the amount of goods vehicles which are
road
, water, Use synonyms
rail
, and pipeline in the Use synonyms
UK
from 1974 to 2002.
Use synonyms
Overall
, Linking Words
it is clear that
Linking Words
transportation
in the Use synonyms
UK
is increasing year by year. Use synonyms
Furthermore
, the position of Linking Words
rail
vehicles Use synonyms
have
the second position in the starting point which is below Change the verb form
has
road
Use synonyms
transportation
.
In 1974, the proportion of the Use synonyms
million
Use synonyms
tonnes
Use synonyms
transportation
using Use synonyms
road
was 70 Use synonyms
million
Use synonyms
tonnes
which was the highest in the Use synonyms
UK
. Use synonyms
Moreover
, the gaps between Linking Words
road
and water vehicles in 1974, 1986, and 2002 fluctuated range which are 30 Use synonyms
million
Use synonyms
tonnes
, 10 Use synonyms
million
Use synonyms
tonnes
, and 35 Use synonyms
million
Use synonyms
tonnes
, respectively.
Use synonyms
On the other hand
, Linking Words
rail
Use synonyms
transportation
slightly increased which was approximately 2 Use synonyms
million
Use synonyms
tonnes
. Use synonyms
In addition
, the range between pipeline and Linking Words
rail
had dramatically decreased from 30 Use synonyms
million
Use synonyms
tonnes
to 5 Use synonyms
million
Use synonyms
tonnes
in 1986. Use synonyms
Moreover
, goods Linking Words
transportation
in the Use synonyms
UK
had replaced the position between water and Use synonyms
rail
Use synonyms
transportation
.Use synonyms