
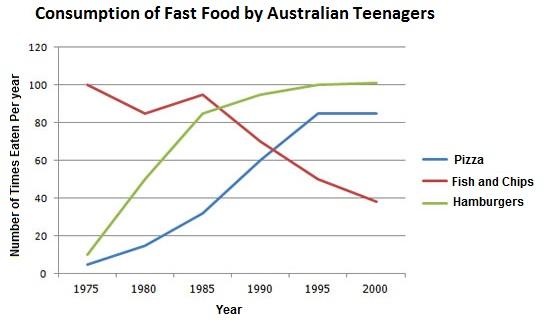
Depicted in the line graph is data about the consumption of fast food by Australian teenagers. It compares the data between the years 1975, 1980, 1985, 1990, 1995, and year 2000. The foods that were observed were pizza, fish and chips, and hamburgers.
Overall
, it can be observed that fish and chips went from the highest in 1975 with 100 times eaten per year to less than 40 in 2020. Linking Words
On the other hand
, both pizza and hamburgers had a significant increase from 1975 to 2000. Linking Words
Furthermore
, it can be seen that pizza was the lowest at the start of the observation and Linking Words
then
went to second place three decades later.
Another noteworthy aspect is the gap between junk food. Hamburgers had the highest increase with less than 20 at the start and ended up with approximately 100 in the 20s. Going second was the iconic Italian food that Linking Words
starts
off lower than hamburger, to more than 80 in three decades later.Wrong verb form
started