
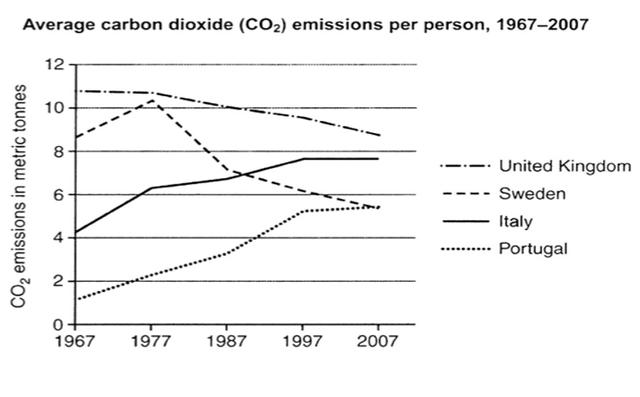
The line chart illustrates the annual carbon dioxide
Use synonyms
pollutions
per person in Fix the agreement mistake
pollution
the
several countries from 1967 to 2007.
It is noticeable that the Correct article usage
apply
emissions
significantly increased for Italy and Portugal. Use synonyms
By contrast
, the pollution from other countries like Linking Words
Sweaden
and the United Kingdom declined in the fourth decades.
In 1967, the lowest Correct your spelling
Sweden
countries
who were produced pollution was Portugal Fix the agreement mistake
country
which
the number of Correct your spelling
with
pollutions
only 1.6 Carbon dioxide Use synonyms
emissions
in metric Use synonyms
tonnes
. Use synonyms
Furthermore
, Linking Words
emissions
for Italy and Portugal Use synonyms
was
dramatically increased in Unnecessary verb
apply
fourth
Correct article usage
the fourth
decades
Fix the agreement mistake
decade
which
the second decade in 1987 was approximately 3.6 metric Correct word choice
and
tonnes
Use synonyms
Use synonyms
emissions
for Portugal and 6.8 metric Change preposition
of emissions
tonnes
Use synonyms
Use synonyms
emissions
for Italy. Change preposition
of emissions
In addition
, in 2007, the gap of gasses between Italy and Portugal reached 2.5 metric Linking Words
tonnes
Use synonyms
Use synonyms
Change preposition
of pollutions
pollutions
.
Fix the agreement mistake
pollution
On the other hand
, air Linking Words
Use synonyms
pollutions
Fix the agreement mistake
pollution
of
Sweden Change preposition
in
had been
increased from 1967 to 1977, after that Verb problem
apply
emissions
Use synonyms
was decline
a half from Change the verb form
declined
emissions
in the first decade Use synonyms
which
the amounts were 6.5 metric Correct pronoun usage
apply
tonnes
, 5.9 metric Use synonyms
tonnes
, and 5.5 metric Use synonyms
tonnes
in 1987,1997, and 2007, respectively. Use synonyms
Therefore
, Linking Words
emissions
of the United Kingdom Use synonyms
was
significantly decreased year by year which were 10.5, 10, 9.7, 9.5, and 9 during Unnecessary verb
apply
period
from 1967 to 2007.Add an article
the period