
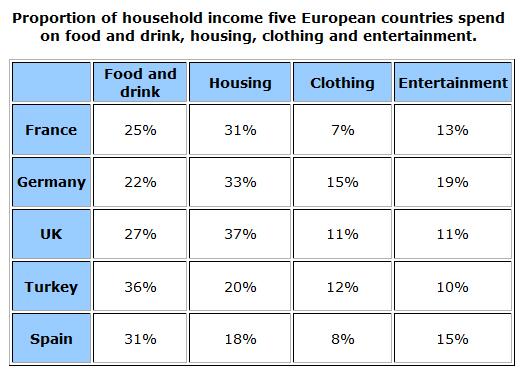
The graph illustrates 5 Europeon
countries
monthly family income that have been used at various items. There are 4 subjects: "Food and drink", "Housing" etc and "Housing" has the highest percentage which is 37% and "clothing" has 7% which is the lowest percentage.
Use synonyms
First,
France, Germany and UK spent more money to the "Housing" Linking Words
then
other items. 31%, 33% and 37% are the percentages of the each Linking Words
countries
. Use synonyms
Then
Turkey consumed at "Food and drink" the most which is 36% and Spain recorded 31% at the "Food and drink" item Linking Words
also
. Linking Words
In addition
, UK has the same value: 11% of the each "Clothing" and "Entertainment".
Next, "Clothing" item has the lowest value in the each 4 Linking Words
countries
. The Use synonyms
countries
are France, Germany, UK and Spain. Use synonyms
Moreover
, France recorded 7% and Spain recorded 8% which are the lowest percentages.
Linking Words
Lastly
, in the "Entertainment" item, 10% of Turkey is the lowest and 19% of Germany is the highest percentage of the chart.Linking Words