
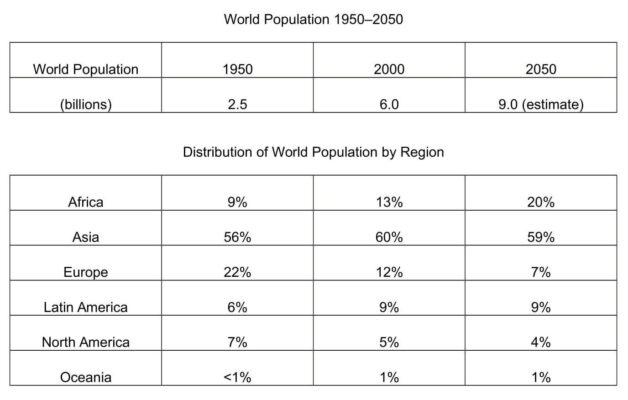
That
tables provide data on Correct determiner usage
The
Use synonyms
population
and distributions of the Correct article usage
the population
world
in two separate yards 9 to 50 and 2000 and Use synonyms
Correct article usage
a projection
projection
of Fix the agreement mistake
projections
situation
in 2015.
It can be seen that the highest number of Correct article usage
the situation
people
live in Asia, Use synonyms
while
Oceania was the country which Linking Words
have
experienced Change the verb form
has
lowest
Correct article usage
the lowest
population
. It is Use synonyms
also
noticeable that the Linking Words
overall
Linking Words
world
Use synonyms
population
will increase by 2050Use synonyms
projected
.
Looking at that table data sets in more detail, it is evident that there was an increase in the number of Verb problem
apply
people
who live in Asia from 56% in 1950 to Use synonyms
people
59% in 2000 which was the highest point on the chart.9% of Use synonyms
Use synonyms
population
was in Africa which increased dramatically from 9% in 1950 to 20% in 2000 a Rise of 11%.Between 1950 and 2000, Add an article
the population
distribution
of Correct article usage
the distribution
world
Use synonyms
Population
by region, Latin America Use synonyms
consists
Wrong verb form
consisted
6
% Change preposition
of 6
in1950
,and it roseCorrect your spelling
in 1950
9
% in 2000. Accounting to the remaining data sets, 22% of Change preposition
to 9
Use synonyms
Correct article usage
the world
world
Change noun form
world's
Population
Use synonyms
distributed
in Europe, which Add a missing verb
is distributed
show
a decrease Correct subject-verb agreement
shows
by
13% Change preposition
of
in
1950 and 2000. The Change preposition
between
people
who live in North America Use synonyms
also
follow the same trend Linking Words
like
Europe which was shown a period of stability with 1%.
In terms of future Change preposition
as
projections
the Add a comma
projections,
world
Use synonyms
population
will follow an increasing trend from 2.5 million to 9.5 estimated in Use synonyms
100-year
periodAdd an article
the 100-year
a 100-year