
The
given
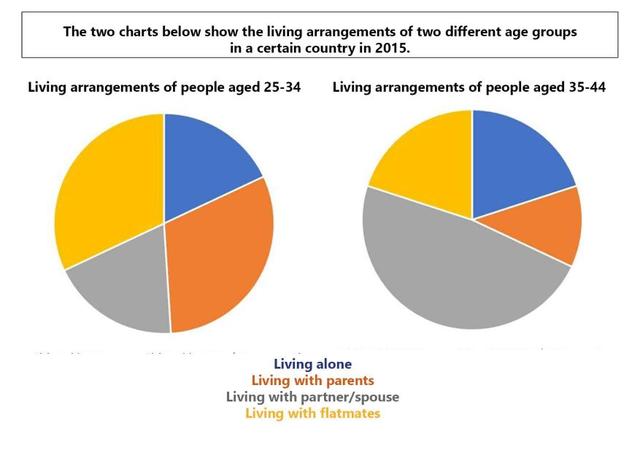
pie charts give information about who people live with, grouped into two various Verb problem
apply
age
in one country in the year 2015.
Fix the agreement mistake
ages
Overall
, what stands out from the graph is thatLinking Words
,
individuals who lived with their parents and with their flatmates, both decreased after turning Remove the comma
apply
to
35 Change preposition
apply
years
old. Use synonyms
In addition
, older Linking Words
poeple prefered
Correct your spelling
people prefer
more
to live with their partners or Correct quantifier usage
apply
spouse
than youngsters.
In 2015, People who were 25 to 34 Fix the agreement mistake
spouses
years
old Use synonyms
more
selected to live with their mothers and fathers and Add a missing verb
were more
also
more chose to share a home with another person, but after getting older they decreased. Linking Words
Also
, the percentage of those who lived alone, between 25 and 34 Linking Words
years
old, almost stayed the same for 35-44 Use synonyms
years
Use synonyms
old
.
Turning to the figure for Correct word choice
apply
yonger
people who lived with a Correct your spelling
younger
girl friend
or Correct your spelling
girlfriend
boy friend
or their spouse, it was the same as Correct your spelling
boyfriend
living
alone percentage, but it saw a Correct article usage
the living
dramatical
trend by around getting triple in the older ages.Replace the word
dramatic