
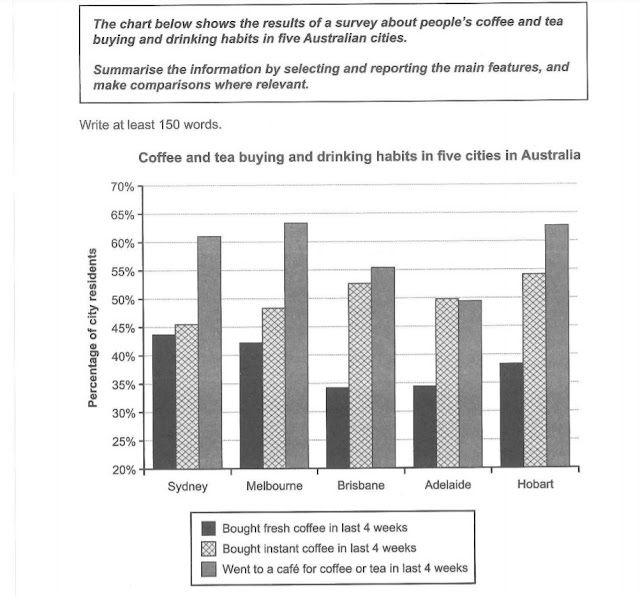
The bar chart compares Australian citizens in five cities in terms of their buying and drinking
coffee
and tea habits in the Use synonyms
last
four weeks. The graph Linking Words
is presented
in percentage of city residents. Wrong verb form
presents
Overall
, the percentage of citizens who went to a cafe for Linking Words
coffee
or tea is the highest in all places except Use synonyms
Adelaide
. Use synonyms
On the other hand
, buying fresh Linking Words
coffee
had become the lowest percentage of the five cities.
Citizens in Sydney, Melbourne, and Hobart came to the cafe to drink and buy caffeine drinks just over three-fifths. Meanwhile, Brisbane and Use synonyms
Adelaide
were coming in less, with 55% and 20% percentages, respectively.
The number of people who prefer fresh Use synonyms
coffee
in Brisbane and Use synonyms
Adelaide
is just under 35%, Use synonyms
while
others reach a record of more than 40% in Sydney and Melbourne and almost 40% in Hobart. Linking Words
Next,
instant Linking Words
coffee
buyers in Hobart and Brisbane are more than half, trailed by Use synonyms
Adelaide
at 50% and Melbourne at 3% lower. Sydney accounted for just a little over 45% of instant Use synonyms
coffee
buying as the lowest.Use synonyms