
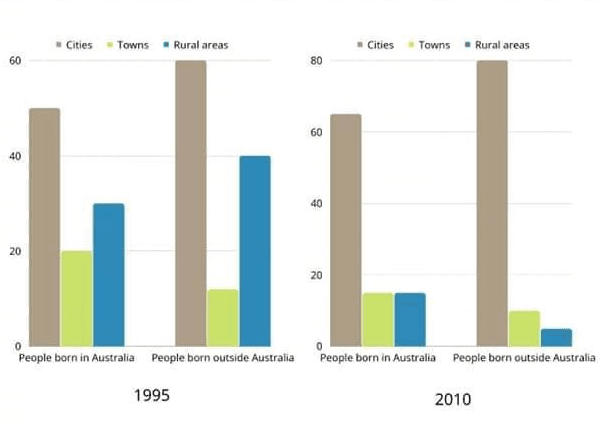
The bar chart explains the variation in
percentage
of individuals Add an article
the percentage
were
born inside and outside Correct pronoun usage
who were
Austaralia
who lived in urban, Correct your spelling
Australia
countryside
and town Use synonyms
areas
in the period between 1995 to 2010. Use synonyms
Overall
, the chart illustrates that Linking Words
ther
is a slight increase for people who live in cities, Correct your spelling
there
while
there is a gradual decrease for those who live in Linking Words
towns
and Use synonyms
Use synonyms
countryside
during the examined period. Correct article usage
the countryside
Moreover
, Linking Words
citizens
who Change preposition
for citizens
born
outside Australia during that period, there Add a missing verb
were born
is
a gradual increase Wrong verb form
was
for
cities and a decrease rate for Change preposition
in
towns
and Use synonyms
countryside
Use synonyms
areas
.
In 1995, the figures Use synonyms
shows
that 60 Change the verb form
show
Use synonyms
percent
of citizens Change the spelling
per cent
born
outside Australia Add a missing verb
were born
for
cities area, Change preposition
in
while
40 Linking Words
Use synonyms
percent
of Australian people Change the spelling
per cent
born
inside the country.
In 2010, there Add a missing verb
were born
is
a sharp increase in urban Wrong verb form
was
areas
, as the Use synonyms
people
born outside was 80 Correct quantifier usage
number of people
Use synonyms
percent
, Change the spelling
per cent
while
Linking Words
those
born inside the rate was 40 Change preposition
for those
Use synonyms
percent
. On Change the spelling
per cent
other
hand, the Correct article usage
the other
individuals
born inside Australia in the Correct quantifier usage
number of individuals
countryside
and Use synonyms
towns
was 18 Use synonyms
Use synonyms
percent
, and those Change the spelling
per cent
who
Correct pronoun usage
apply
born
outside in Add a missing verb
were born
towns
and urban Use synonyms
areas
Use synonyms
ws
15% and 10% respectively.Correct your spelling
was