
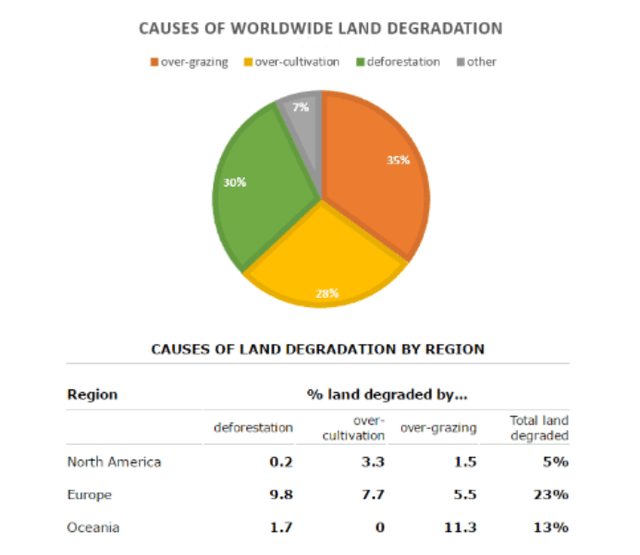
The two illustrations summarize data on the causes of becoming less productive land all over the world. The pie chart presents some reasons for land degradation,
whereas
the table portrays these facts by region.
From an Linking Words
overall
perspective, the categories Linking Words
have
taken into consideration are deforestation, over-grazing, overcultivation, and other causes. Unnecessary verb
apply
Moreover
, the regions Linking Words
have
taken into consideration are North America, Europe, and Oceania. Unnecessary verb
apply
Furthermore
, what stands out is that European lands were in the most danger as they degraded by 23% in comparison with other lands during the 1990s.
First and foremost, it can be seen from the pie chart that in terms of land degradation causes, except Linking Words
Change preposition
for other
other category
, the rest have had approximately the same portion which was 35%, 30% and 28% for over-gazing, deforestation and over-cultivation segment respectively.
Change the wording
another category
other categories
On the other hand
, regarding the analysis from the table, the least region that was threatened by degradation was North America with just 5 Linking Words
percent
, Change the spelling
per cent
while
Oceania’s portion was 13%. Linking Words
In addition
, the highest was Europe with 23%.Linking Words