
This
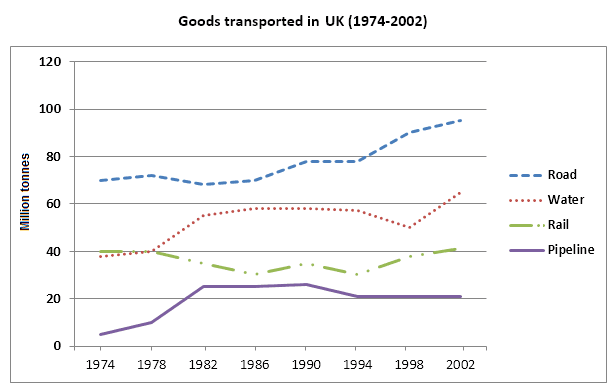
graph illustrates the goods transported in the UK from 1972 to 2002 by four different modes of transport.
Linking Words
Overall
, goods carried by roads, on boats and through pipes all displayed an upward trend over the entire time period. The exception to Linking Words
this
was rail, which fluctuated throughout the course.
Linking Words
To begin
with, in 1974, shipping by road was dramatically high, which was approximately 70 Linking Words
million
Use synonyms
tonnes
, Use synonyms
however
, the quantities of water and rail were close, which was 39% and 40% respectively. The pipeline only transferred about 3 Linking Words
million
Use synonyms
tonnes
.
Use synonyms
Moreover
, road transportation was a considerable surge, which reached a peak at 90 Linking Words
million
Use synonyms
tonnes
in 2002. 39 Use synonyms
million
Use synonyms
tonnes
of goods were transported by water, which exceeded the railway in 1978. The rail remained the same number at 40 from the beginning, Use synonyms
whereas
the pipeline rose from 3 to 20, which was the most significant growth in four modes.Linking Words