
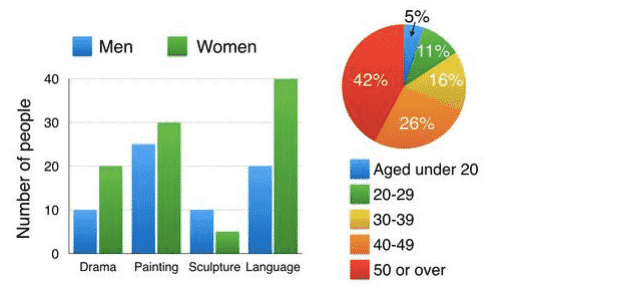
The graph displays the numbers of people with different sexes attending different courses in 2009.The pie chart indicates the ages of those who participated in these classes.
Overall
, language and painting have the highest share of attendances for both genders with women having a higher share than the males in almost all the classes.Linking Words
Furthermore
, painting has the highest numbers for males Linking Words
while
for the females in language.Linking Words
Moreover
, based on the pie chart , most of the participants are at least 50 years old followed by those under 20 years old with the lowest share.
As can be observed, 40% of women have chosen the language course which for the men its only 20%.Followed by painting with females at 30 and men at slightly over 20 per Linking Words
cent
.Use synonyms
Nonetheless
, in drama and sculpture numbers for men is 10% each which for females it stands at 20 for drama and less than 5 per Linking Words
cent
.
Use synonyms
Finally
, 42% of participants are above 50 years followed by those between 40 to 49.Linking Words
Nevertheless
, ages between 30 and 39 and 20 to 29 had 16 and 11 per Linking Words
cent
of the total those attending these courses.Use synonyms
Last
but not least, only 5 per Linking Words
cent
of learners were ages under 20.Use synonyms