
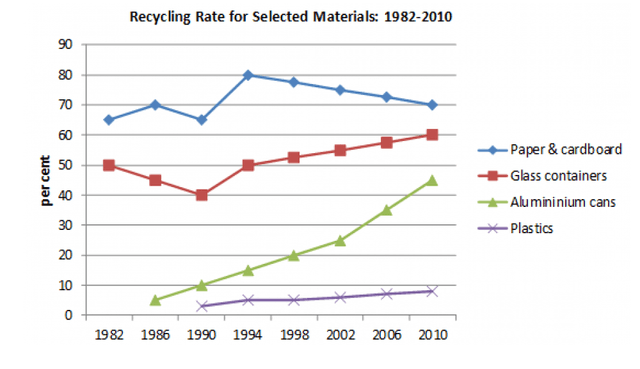
The line chart illustrates the percentage of recycling ratings from four types of material between 1982 and 2010 in a specific country.
Overall
, all four kinds of material were increased over the period, Linking Words
while
paper and cardboard had the biggest proportion compared to the other categories. The other significant feature of Linking Words
this
graph is that aluminium cans nearly ninefold its value in just 24 years.
Cardboard & paper had been recycled around 65% as the highest value in 1982. It Linking Words
then
experienced a dramatic growth to approximately 80% in 12 years before gradually declining to just 70% in 2010, and still the biggest among others. Glass container’s recycling rate was in second place at the start of the period at precisely 50% but moderately decreased to 40% and Linking Words
then
steadily rose to 60% in 2010.
Plastics were first recycled in 1990 with only just 3% as the lowest in that year and it had a slight increase to just below 10% in 2010. Linking Words
However
, in 1986, the Aluminium cans recycling rate started at just 5% and Linking Words
this
sharply increased by roughly 40% to 45% Linking Words
at the end
of the time period.Linking Words