
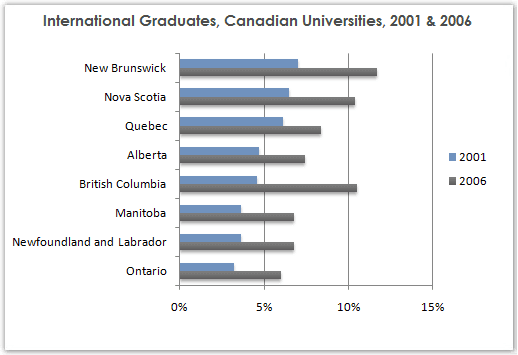
The diagram illustrates the comparison of the share of international students among university graduates in various Canadian cities from 2001 to 2006.
Overall
, it can be seen that Linking Words
although
all states experienced an increase in Linking Words
this
trend, British Columbia had the widest gap. Meanwhile, the lowest rate was Linking Words
Ontario
.
The highest percentage of Change preposition
in Ontario
this
data was New Brunswick with more than 5% in 2001 and around 15% in 2006. Nova Scotia and Quebec showed the same rate in 2001, but Quebec only rose by 3% which makes it below the previous state. Linking Words
Although
Alberta and British Columbia share the same position, British Columbia increased significantly to reach more than 10% Linking Words
as well as
Nova Scotia.
Linking Words
On the other hand
, Manitoba, Newfoundland Linking Words
and
Labrador, and Ontario were the lowest cities Correct word choice
apply
who
had study abroad pupils, Correct pronoun usage
that
accounted
Wrong verb form
accounting
at
below 5% in 2001. Change preposition
for
However
, those areas witnessed a slight rise; Linking Words
finally
, they arrived at approximately 6%, but Ontario was lower than the other two groups.Linking Words