The maps below show the village of Stokeford in 1930 and 2010. Summarise the information by selecting and reporting the main features, and make comparison where relevent.

The maps below show the village of Stokeford in 1930 and 2010. Summarise the information by selecting and reporting the main features, and make comparison where relevent.
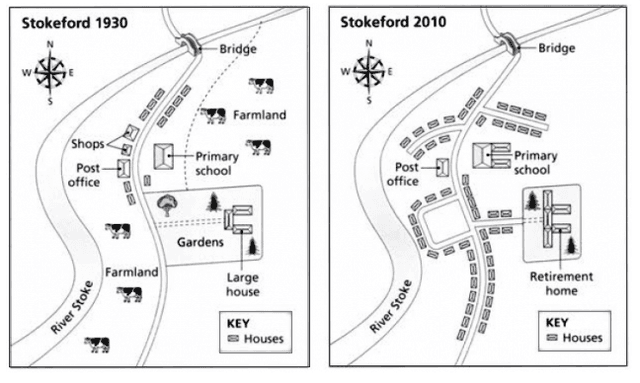
The maps illustrate the developments which took place in the village of Stakeford in 1930 and 2010.
Overall
, a comparison of the two maps reveals a partial transformation from a largely rural to a mainly urban
area
. In the year 1930, the village had a large farmland
area
with several houses, but by the year 2010, the village changed a lot. The most noticeable is that farmland was transformed into a residential
area
on the west of the main road. The shops were demolished and replaced by private houses.
Likewise
, farmland on the east of the road was
also
converted into a residential
area
, meanwhile, the building of the school was expanded with additional blocks. The large house was rebuilt and used as a retirement house.
Submitted by s_syedy on

Unauthorized use and/or duplication of this material without express and written permission from this site’s author and/or owner is strictly prohibited. Excerpts and links may be used, provided that full and clear credit is given to Writing9 with appropriate and specific direction to the original content.

Common mistake: Your writing should be 150-250 words.
Basic structure: Change the fourth paragraph.
Vocabulary: Replace the words area with synonyms.
Vocabulary: Only 4 basic words for charts were used.
Vocabulary: The word "maps" was used 2 times.
Vocabulary: Use several vocabularies to present the data in the fourth paragraph.
What to do next:
Look at other essays: